Bahar Lab title bar


Chromosomal dynamics predicted by an elastic network model explains genome-wide accessibility and long-range couplings

Natalie Sauerwald, She Zhang, Carl Kingsford, and Ivet Bahar

 
From Hi-C maps to Chromosome Dynamics and Cross-Correlations between Gene Loci

From Hi-C maps to Chromosome Dynamics and Cross-Correlations between Gene Loci

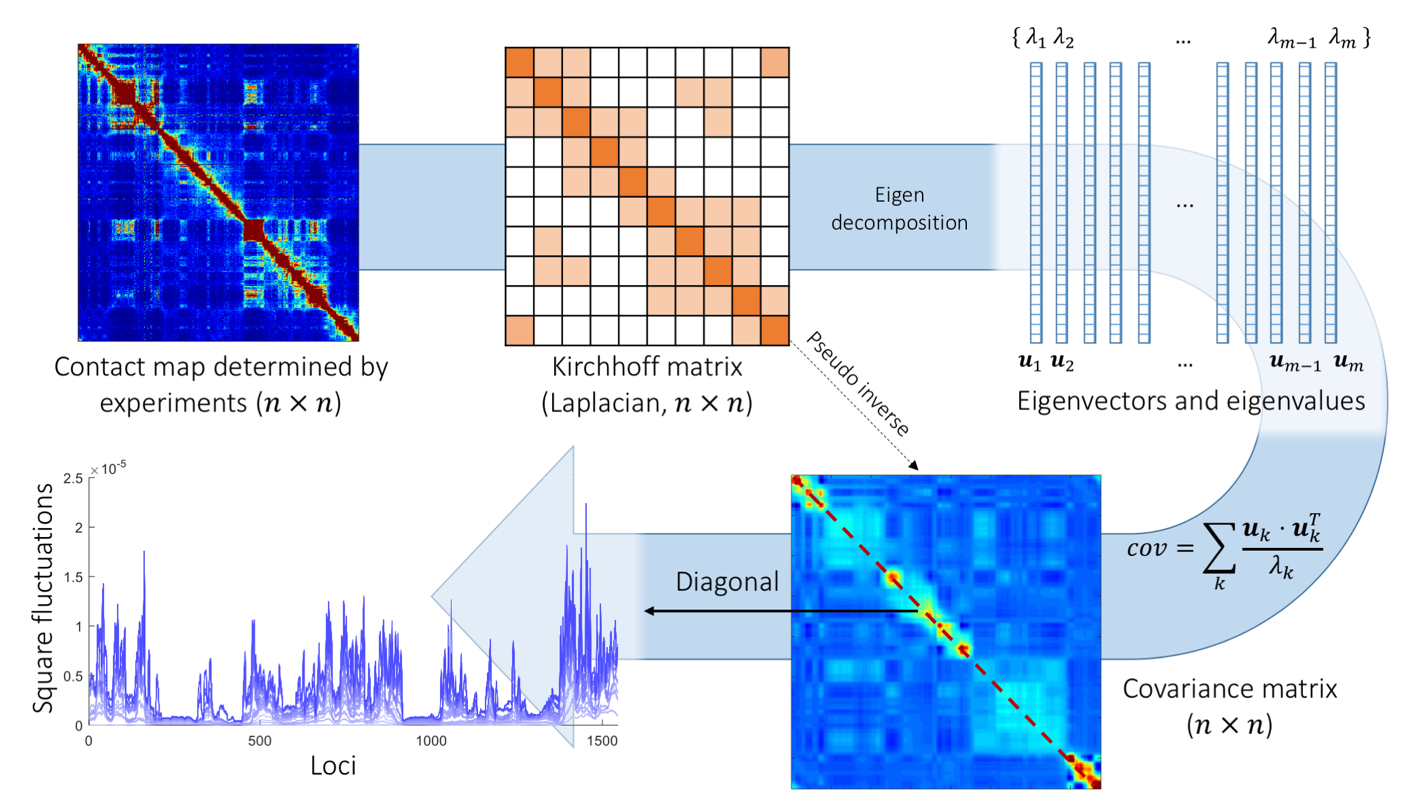
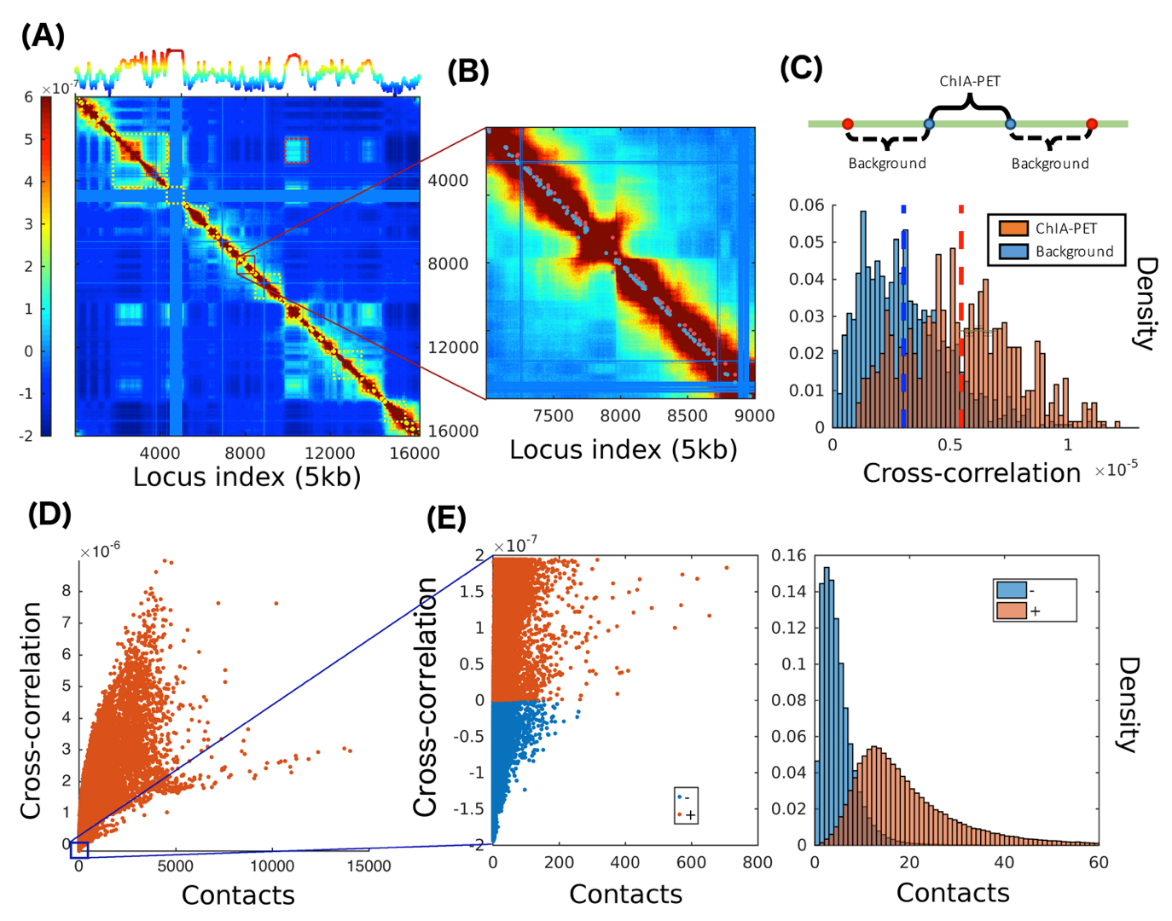
This is the first structure-based study of chromosomal dynamics using elastic network models, between the Bahar and Kingsford labs. In this study, we constructed Gaussian Network Models (GNM) for chromosome structures based on Hi-C maps. The GNM analysis (Figure 1) permits us to predict chromatin mobility profile, identify hierarchical structural domains, and discover cross-correlated distal domains (CCDDs). These biological findings were found consistent with various types of experimental data, including chromatin accessibility (ATAC-seq and DNase-seq), interacting pairs of regulatory elements and gene loci (ChIA-PET; Figure 2), and gene co-expression.

  schematic description
Figure 1. Schematic description of GNM methodology applied to Hi-C data. The interloci contact data represented by the Hi-C map (upper left, for n genomic bins (loci)) is used to construct the GNM Kirchhoff matrix, G (top, middle). Eigenvalue decomposition of G yields a series of eigenmodes which are used for computing the covariance matrix (lower, right), the diagonal elements of which reflect the mobility profile of the loci (bottom, left), and the off-diagonal parts provide information on locus-locus spatial cross-correlations.
  covariance map
Figure 2. Covariance map computed for chromosome 17 and comparison with ChIA-PET data and contacts from Hi-C experiments in GM12878. (A) Covariance matrix computed for chromosome 17. The curve on the upper abscissa shows the average overall off-diagonal elements in each column, which provides a metric of the coupling of individual loci to all others. The blocks along the diagonal indicate loci clusters of different sizes that form strongly coupled clusters. (B) Close-up view of a region along the diagonal. Red dots near the diagonal indicate pairs identified by ChIA-PET to interact with each other; nearby blue points are control/background pairs. (C) Stronger cross-correlations of ChIA-PET pairs compared to the background pairs. (D) Dependence of cross-correlations on the number of contacts observed in Hi-C experiments. A broad distribution is observed, indicating the effect of the overall network topology (beyond local contacts) on the observed cross-correlations. (E) Loci pairs exhibiting anti-correlated movements usually have fewer contacts, compared to those exhibiting correlated pairs of the same strength.

References:
Sauerwald N, Zhang S, Kingsford C, Bahar I. (2017) Chromosomal dynamics predicted by an elastic network model explains genome-wide accessibility and long-range couplings Nucleic Acids Res 45:3663-3673 PMID: 28334818