
|
|
Theory, Dataset, and Methods
Overview
Parameter optimization and Benchmarking
Probabilistic Matrix Factorization (PMF) is a broadly used machine learning method, which has been successfully adopted to predicting drug-target interactions (Cobanoglu, et al., 2013). The known drug-target interactions between N drugs and M targets (proteins) can be described using the interaction matrix RN×M the elements of which are defined as:
![]() (1)
(1)
In the PMF, drugs and targets
are represented by D-dimensional vectors of latent variables (LVs),
denoted as ![]() (1
£ i £ N) and
(1
£ i £ N) and ![]() (1
£ j £ M), respectively (Figure 1).
The interaction matrix RN×M can be modeled as the product of
two matrices UTN×D and VD×M for
the N drugs and M targets respectively, and the corresponding the
predicted interaction matrix R’ is
(1
£ j £ M), respectively (Figure 1).
The interaction matrix RN×M can be modeled as the product of
two matrices UTN×D and VD×M for
the N drugs and M targets respectively, and the corresponding the
predicted interaction matrix R’ is
![]() (2)
(2)
Training the PMF model is to find the best approximation for the known N×M drug-target interaction matrix R under the giving loss function:
![]() (3)
(3)
where ![]() is
the regularization term to avoid overfitting.
is
the regularization term to avoid overfitting.
Once we obtained the optimal U and V matrices,
the predicted confidence score for the interaction between a drug i and
a target j is calculated from the dot product of ![]() and
and
![]() ,
i.e. the product
,
i.e. the product ![]() .
.
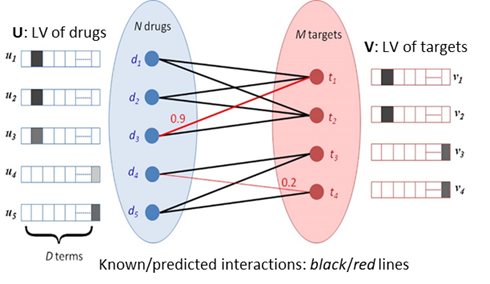
Figure 1. Qualitative illustration
of the method for identifying drug-target interactions. The known interactions
between drugs and targets (indicated by black lines) are used to learn the latent vectors (LVs, shown adjacent to
each node) that describe each drug and target. The dot product of the LVs for
each pair of drug ![]() and target
and target ![]() defines the
predicted confidence score of the corresponding connection (red lines) (Cobanoglu, et al., 2013) .
defines the
predicted confidence score of the corresponding connection (red lines) (Cobanoglu, et al., 2013) .
QuartataWeb uses DrugBank v5.1.1 (Wishart, et al., 2018) for drug-target interactions and STITCH (Szklarczyk, et al., 2016) database for protein-small molecule (or chemical) interactions, in addition to KEGG (Kanehisa, et al., 2017) Pathways and GO (Huntley, et al., 2015) for further analysis of cellular pathways and biological functions.
Table 1. The content of the data sources used in QuartataWeb
|
Data type and properties |
DrugBank 5.1 (Wishart, et al., 2018) |
STITCH 5 (Szklarczyk, et al., 2016) (human) |
|||
|
Approved |
All |
Experimental |
|||
|
# of drugs/chemicals (N) |
1,883 |
5,494 |
315,514 |
||
|
# of targets (M) |
2,244 |
2,807 |
9,457 |
||
|
Interaction space (NxM) |
4,225,452 |
15,421,658 |
2.98 billion |
||
|
known interactions (S) |
9,253 |
14,983 |
5,364,673 |
||
|
Occupancy of R (S/[NxM]) |
0.0022 |
0.0010 |
0.0018 |
||
|
Data type and properties |
KEGG (Kanehisa, et al., 2017) (human) |
GOA (Huntley, et al., 2015) (human) |
|||
|
Molecular Function |
Biological Process |
Cellular component |
|||
|
# of genes |
19,124 |
2,807 |
|||
|
# of pathways/GO terms |
323 |
2,346 |
6,892 |
897 |
|
|
# of associations |
28,664 |
11,475 |
39,510 |
15,160 |
|
DrugBank-approved dataset. A total of 9,253 drug-target interactions between 1,883 approved drugs and 2,244 human targets were extracted from DrugBank v5.1.1 released on 07-03-2018. DrugBank is a frequently updated bioinformatics and cheminformatics resource that combines drug data with comprehensive target information. The sparsity of the approved drug-target interaction matrix is 0.9978 with an interaction space of 4,225,452 (calculated by 1,883*2,244), or occupancy is 0.0022.
DrugBank-all dataset. A total of 14,983 drug-target interactions between 5,494 drugs and 2,807 human targets were extracted from DrugBank v5.1.1 as well. The DrugBank-all dataset includes drugs from six different groups: approved, nutraceutical, illicit, withdrawn, investigational and experimental. The sparsity of this drug-target interaction matrix is 0.9990 with an interaction space of 15,421,658.
STITCH experimental dataset. A total of 5.3 million chemical-target interactions between 315,514 chemicals and 9,457 human targets were extracted from STITCH v5 human experimental subset. STITCH is an extensive database that integrates chemical-protein interactions from experiments, other databases, literature and predictions, resulting in interactions between 430,000 chemicals and 9,643,763 proteins across 2,031 genomes. We have used the subset of human protein-chemicals data supported by experimental evidence, ending up with a chemical-protein interaction matrix with sparsity of 0.9982 and a huge interaction space of 2.98 billion.
KEGG. QuartataWeb uses the 28,664 gene-pathway associations between 19,124 human genes and 323 human pathways extracted from KEGG Pathway DB (Table 1). Proteins are mapped to genes following UniProt (The UniProt, 2017) annotations, and then mapped to pathways through gene-pathway associations. Based on the known and predicted CTIs, drugs/chemicals can then be connected to affected pathways.
GOA. A total of 2,807 target genes in our datasets were mapped to GO terms, comprising 11,475 molecular functions, 39,150 biological processes, and 15,160 cellular components (Table 1). The connection between targets and GO annotations is established through UniProt gene identifiers. Likewise, drugs/chemicals are mapped to GOA via the associated known and predicted targets, which enables users to assess the molecular functions, biological processes and cellular components potentially affected by chemicals.
Figure 2 shows the histogram of drug/chemical/target degree in each dataset. Most of the drugs or targets in DrugBank have degrees less than 40. In the DrugBank-approved set, the maximal number of targets for a given drug is 303, and the maximal number of drugs for a given target is 104. On average, there are 4.91 targets per drug and 4.12 drugs per target. In the DrugBank-all dataset, the maximal number of targets per drug is 303, and the maximal number of drugs per target is 137, and the averages are 2.73 targets/drug and 5.34 drugs/target. The interactions in STITCH are much more extensive. Most chemicals or targets have degrees less than 250. Figure 2 displays the degree distribution of chemicals or targets with degrees < 250. The maximal number of targets per chemical is 4,044, and the maximal number of chemicals per target is 26,803. The averages are 16.45 targets/chemical and 541.82 chemicals/target. Yet, the median values are much smaller, 1 and 17, respectively.
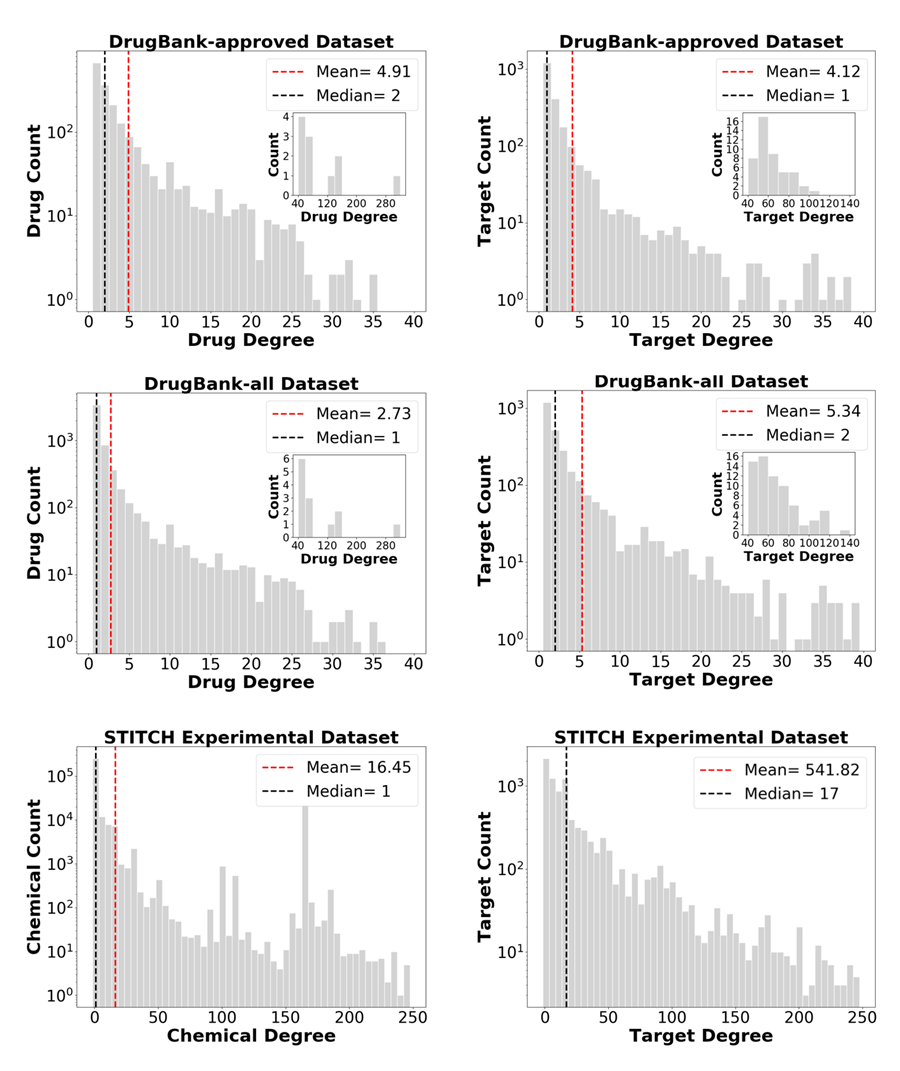
Figure 2. Histogram of the degrees of drugs/chemicals and targets in each of the three examined datasets. Most of the drugs or targets in DrugBank have degrees below 40. The drugs or targets with degree over 40 are shown in the inset. Most of the chemicals or targets in STITCH have degrees less than 250, and the degree distribution of these chemicals or targets are shown in the corresponding plots. The dashed lines indicate the mean and median in each case.
Parameter optimization and Benchmarking
The latent factor models (LFMs) were trained on the DrugBank-approved, DrugBank-all and STITCH-experimental datasets, separately. For training DrugBank datasets, we applied 10-fold cross validation technique to select the optimal hyperparameters dimensionality (D) and optimization coefficient (λ), as well as the optimal cutoff values for confidence score. In the 10-fold cross validation, the total known drug-target interactions were evenly divided into 10 sets, and then we utilized 9 sets as training data and the remaining 1 set as testing data. We repeated it for ten times such that each subset could be tested. In the simulations, the 10-fold cross validation were repeated 10 times independently and the average values were evaluated and reported.
DrugBank contains only binary inputs, either 0 (unknown interaction) or 1 (known interaction). We used a cutoff confidence score to decide whether the prediction was positive or negative, so that we could evaluate whether they were true positive (TP), false positive (FP), true negative (TN) or false negative (FN). Accordingly, any drug-target pair with predicted confidence score above the cutoff value was considered as positives, otherwise as negative. The sensitivity (TP rate) and specificity (TN rate)
![]() (4)
(4)
![]() (5)
(5)
under different cutoff values were calculated to measure the performance. For DrugBank-approved dataset, the training dataset included 8,328 positive drug-target pairs, the testing dataset included 925 positives, and 925 randomly sampled unknown drug-target interactions were considered as negatives. For DrugBank-all dataset, the training dataset included 13,485 positive drug-target pairs, the testing set included 1,498 positives, and 1,498 randomly sampled unknown drug-target interactions (negatives). In the parameter tuning section, ROC AUC was used to select the optimal hyperparameters the dimensionality D and the regularization parameter λ. D was scanned in the range 30-100 as [30, 50, 70, 90, 110], the parameter λ was scanned from [1e-6, 1e-5, 0.0001, 0.001, 0.01, 0.1, 1], ROC AUC evaluation results are shown in Figure 3. For DrugBank-approved dataset, D = 50, λ=0.01 were selected as optimal parameters with ROC AUC of 0.836. The optimal cutoff value is 0.3, and the corresponding sensitivity was 0.582, the specificity was 0.992 and the precision (defined as the ratio of correctly predicted ones over all positives) was 0.987. For DrugBank-all dataset, D = 50, λ = 0.0001 were selected as the optimal parameters with ROC AUC of 0.836, the optimal cutoff score is 0.2, with the sensitivity equal to 0.492, specificity equal to 0.991, and precision of 0.984.
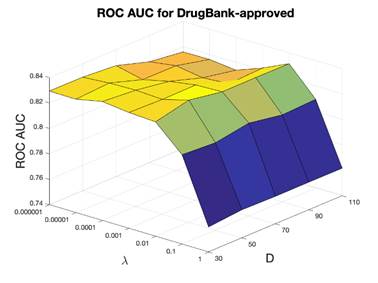
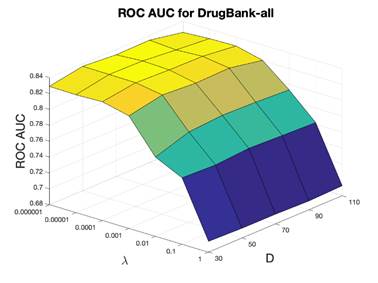
Figure 3. ROC AUC of the 10-fold cross validation for evaluating DrugBank-approved and DrugBank-all. x-axis is the optimization coefficient (λ), y-axis is the dimensionality (D), and z-axis is the ROC AUC.
Table 2. The parameters used to train LFMs in QuartataWeb
|
Parameters |
DrugBank 5.1 |
STITCH 5 (human) |
|
|
Approved |
All |
Experimental |
|
|
Latent vector dimensionality (D) |
50 |
50 |
100 |
|
Regularization term (l) |
0.01 |
0.0001 |
0.5 |
Table 3. Performance of QuartataWeb observed in cross-validation tests
|
Dataset |
Cross-validation |
Training set |
Test set |
Results |
||||||
|
Size(d) |
Size(d) |
Positive (e) |
Negative (f) |
AUC(g) |
Sensitivity (h) |
Specificity (i) |
Precision/ RMSE(j) |
|||
|
DrugBank-approved (a) |
10-fold |
8,328 |
1,850 |
925 |
925 |
0.836 ± 0.010 |
0.582 |
0.992 |
0.987 (Precision) |
|
|
DrugBank-all(b) |
10-fold |
13,485 |
2,996 |
1,498 |
1,498 |
0.836 ± 0.009 |
0.492 |
0.991 |
0.984 (Precision) |
|
|
STITCH-experimen-tal(c) |
10-fold |
4,828,203 |
1,072,934 |
536,467 |
536,467 |
0.870 ± 0.015 |
N/A |
N/A |
0.0328 (RMSE) |
|
|
(a) approved drugs and their targets in DrugBank v5; (b) all experimentally verified drugs and targets in DrugBank v5.1; (c)experimentally confirmed chemicals and proteins corresponding to human targets in STITCH v5; (d)Size: number of interactions in the training and validation data sets; (e)Positive: number of known interactions; (f)Negative: number of false interactions; (g)AUC: area under the receiver operating characteristics curve; (h)Sensitivity: TP / (TP + FN); (i)Specificity: TN / (FP + TN); (j)Precision=TP/(TP+FP); root-mean-square error (RMSE) compared to the confidence scores reported in STITCH for known interactions. TP: true positive, FP: false positive, FN: false negative, TN: true negative. Sensitivity and Specificity results are not available for STITCH as the input training data are continuous confidence score instead of binary input. Instead, we use RMSE as metric. |
||||||||||
To demonstrate the ability of the method to recapitulate unknown drug-target interactions, a benchmarking test was performed by hiding 70% of known interactions and examining the number of true positives in the top 1000 ranking predictions. As shown in Figure 4, there are 684 and 706 TPs out of top 1000 predictions in the DrugBank-approved and DrugBank-all datasets, respectively, when hiding 70% of the known interactions. Similar performance was accomplished for a significantly smaller set with DrugBank v3.0 (Knox, et al., 2011) in an earlier study (Cobanoglu, et al., 2015).
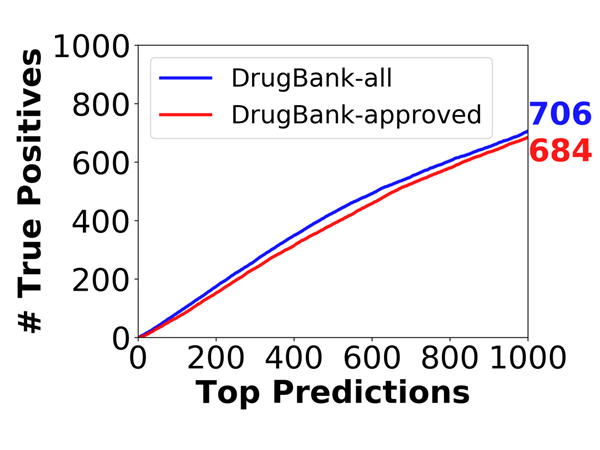
Figure 4. Ability of the method to recapitulate hidden drug–target interactions. Simulations were repeated n = 44 times for each of the 1<m<1000 predictions, and the number of true positives is plotted for each run. The blue solid curves refer to the average performance obtained when hiding 70% in the DrugBank approved dataset and the DrugBank all dataset.
In addition, the top 1,000 predicted drug-target pairs from the LFM generated for the full DrugBank-approved (1,883 drugs and 2,244 targets) and DrugBank-all dataset (5,494 drugs and 2,807 targets) were examined using other CTI DBs STITCH, ChEMBL (Mendez, et al., 2019) and TTD (Li, et al., 2018), respectively. 376 of DrugBank-approved LFM ‘predicted’ pairs were actually listed among the experimentally confirmed pairs in STITCH, 255 pairs were reported in ChEMBL, and 14 pairs in TTD, ending up with 459 confirmed pairs (because of the overlaps between those confirmed in different databases). 341 of DrugBank-all LFM ‘predicted’ pairs were listed in STITCH, 260 pairs in ChEMBL, and 16 pairs in TTD, ending up with 438 confirmed pairs. This demonstrated the predictive power of the current tool. The list of confirmed drug-target pairs, along with their IDs in different databases can be found here (linked to the table). It remains to be seen if the remaining pairs are confirmed in the future.
The STITCH experimental dataset, on the other hand, is a much more extensive dataset containing chemical-protein pairs with continuous interaction confidence scores ranging from 0 to 1. 10-fold cross validation was applied to select the optimal hyperparameters dimensionality (D) and optimization coefficient (λ), and the root-mean-square error (RMSE) between the confidence scores of the training data and testing data and those reported in STITCH database
![]() (6)
(6)
were used as metrics to assess the performance of the method, where S’ refers to the number of training data or testing data. The size of training data was 4,291,739 and the size of testing data was 1,072,934. Parameter D was scanned from: {20, 40, 60, 80, 100, 120}, parameter λ was scanned from: {0.001, 0.01, 0.05, 0.1, 0.5, 1}. D = 100, λ = 0.5 were selected as optimal parameters. The corresponding training RMSE was 0.0093, and testing RMSE was 0.0328.
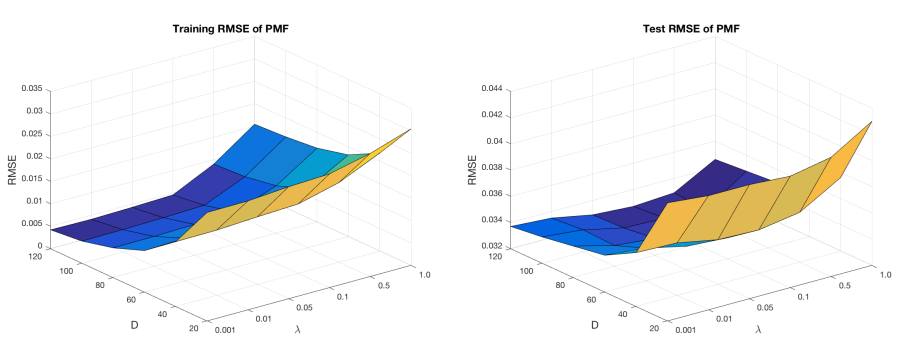
Figure 5. RMSE of the 10-fold cross validation for evaluating STITCH experimental dataset. x-axis is the dimensionality (D), y-axis is the optimization coefficient (λ) and z-axis is the root-mean-square error (RMSE).
We calculated the confidence score for each unknown drug-target pair by the dot product of the LVs of the corresponding drug and target, for each dataset. Figure 6 shows the histograms of the known and unknown interactions (left), as well as the predicted confidence score (right) for three datasets.
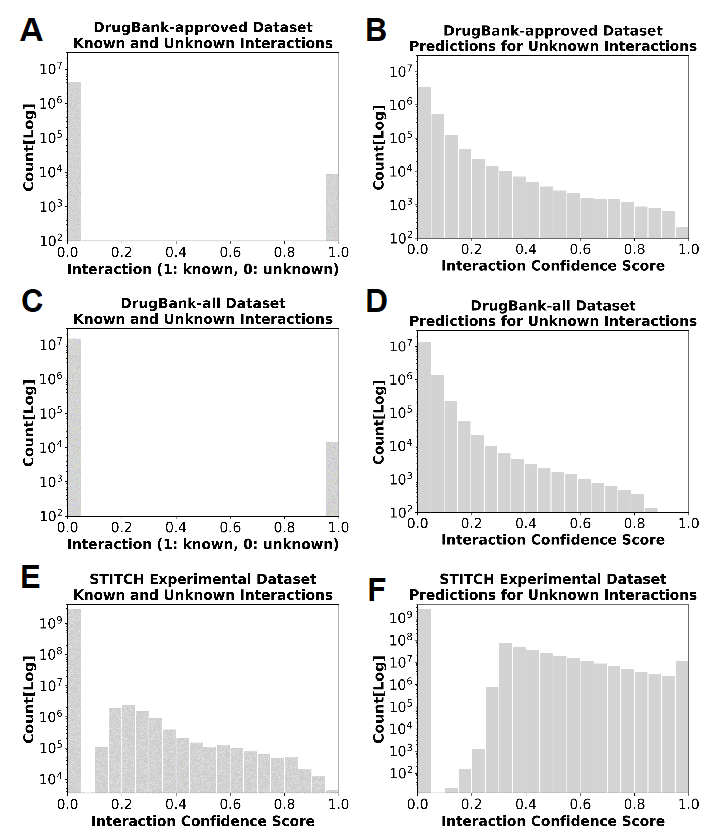
Figure 6. Histogram of interaction confidence scores for each dataset. (left) Histogram of scores (or interaction probabilities) assigned to known and unknown interactions in the three datasets. Note that the values in DrugBank are binary. (right) Histograms of the confidence scores predicted by QuartataWeb for the unknown drug/chemical-target pairs (right). Scores range from 0 to 1, where close to 0 means low probability of interaction, close to 1 means high probability of interaction. Results are obtained with the optimal parameters selected above.
Based on drug/chemical-target interaction patterns, drug-drug (or chemical-chemical) similarities can be calculated by the correlation cosine between the LVs corresponding to the two drugs or two chemicals. 2D fingerprint similarities of the drugs or chemicals were also calculated with RDKit software (http://rdkit.org) and stored as references to enable comparison based on interactions patterns (predicted by Quartata) and based on structural patterns (based on RDKit). With the same idea, we calculated target-target similarities.
CTI-pattern-based similarity. Chemical-chemical or target-target similarities based on CTI patterns are calculated by evaluating the correlation cosine between two chemical LVs (ui and uj) or two target LVs (vi and vj) as
![]() (7)
(7)
![]() (8)
(8)
The CTI-pattern-based similarities range from -1 to 1, where 1 represents the highest similarity. Histograms of the chemical-chemical or target-target similarities based on CTI patterns for each dataset can be found in Figure 7.
Structure-based similarity. The Tanimoto coefficient Tab between the 2D fingerprints of two chemicals is calculated to provide a metric of structure-based similarity (Bajusz, et al., 2015) as
![]() (9)
(9)
where a and b represent 2D fingerprint binary vectors, the Tanimoto coefficient ranges from 0 to 1, and 1 is the highest similarity.
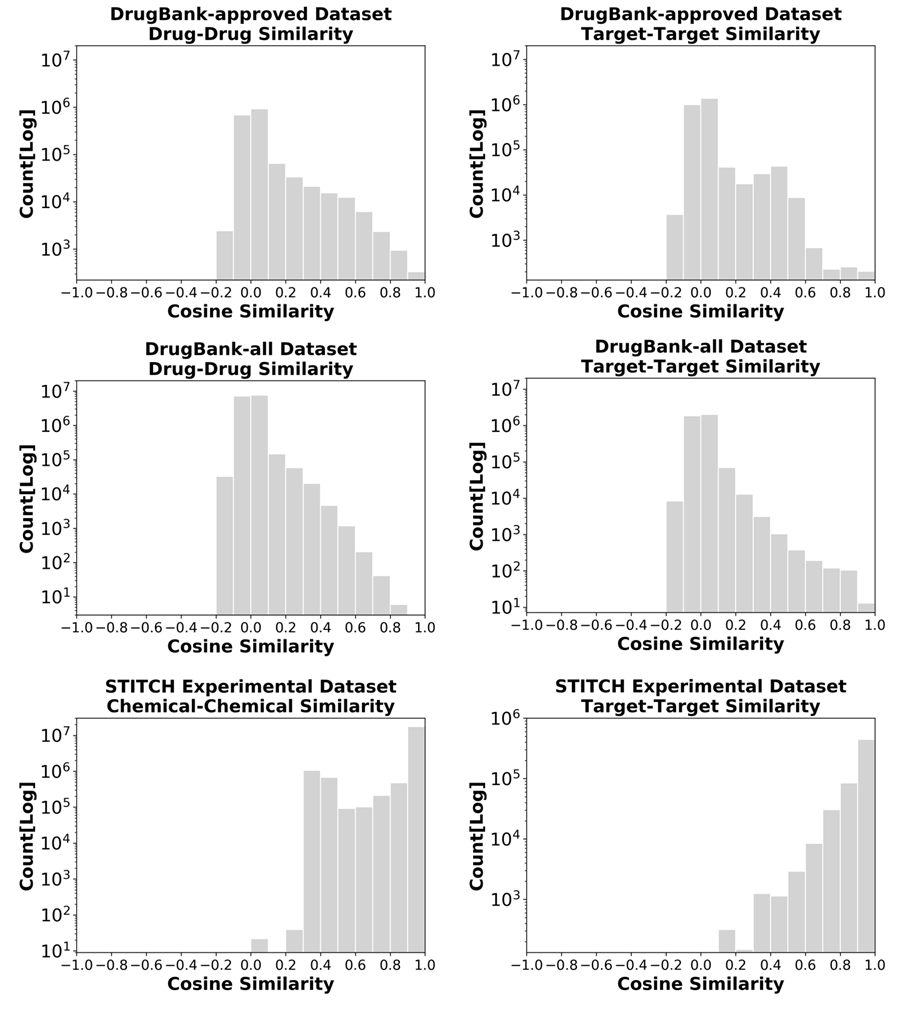
Figure 7. Histogram of drug-drug/chemical-chemcial and target-target similarities evaluated for three datasets.
Gene-pathway associations from the human subset in KEGG PATHWAY (Release 84.1, December 1, 2017) and the protein annotations from Uniprot Knowledgebase (KB) were stored on the QuartataWeb server. A total number of 28,664 gene-pathway associations included in 323 human pathways were downloaded from KEGG PATHWAY, the proteins listed in DrugBank v5.0 were mapped onto these pathways. Likewise, drugs are mapped to pathways via the associated targets. We define the known and predicted pathways for a drug as follows: the known pathways for a drug are those mapped based on the known drug-target interactions, and the predicted pathways for a drug are those based on newly predicted drug-target interactions.
Enrichment analysis identifies sub-populations that are statistically overrepresented in an ensemble. The hypergeometric p-value has been widely used to investigate whether genes from pre-defined functional terms, e.g., pathway, are enriched in the differentially expressed genes. For example, let q be the total number of drugs that are mapped to a certain pathway A; let N and T be the total number of drugs in our background database and the number of drugs we evaluated. The number of drugs that are mapped onto pathway A in our evaluation is denoted by n. The null hypothesis of the hypergeometric test is that pathway A is irrelevant to our evaluated drugs. Given (N, T, q), we can model distribution of n under the null hypothesis, and the p-value represents the probability of randomly observing n or more drugs mapped to pathway A from N total evaluated drugs.
![]() (10)
(10)
where ![]() is
the binomial coefficient.
is
the binomial coefficient.
For multiple testing, Benjamini-Hochberg method (Benjamini and Yekutieli, 2001) is applied to correct false discovery rate (FDR). Giving T as the total number of the evaluated As, the hypergeometric p-values are sorted from smallest to largest, and the adjusted p-value of the ith item (pi*) is calculated as
![]() (11)
(11)
The adjustment limits the FDR to a selected cutoff level alpha (e.g. adjusted p-value < 0.05), which indicates that the fraction of false significant As from all the significant As identified is expected to be less than alpha.
The enrichment score used in the provided enrichment output bar plots is defined as
![]() (12)
(12)
where higher enrichment score represents higher significance.
Bajusz, D., Racz, A. and Heberger, K. (2015) Why is Tanimoto index an appropriate choice for fingerprint-based similarity calculations? J Cheminform, 7:20.
Benjamini, Y. and Yekutieli, D. (2001) The control of the false discovery rate in multiple testing under dependency. Ann. Stat, 29, 1165-1188.
Cobanoglu, M.C., et al. (2013) Predicting drug-target interactions using probabilistic matrix factorization. J Chem Inf Model, 53(12), 3399-3409.
Cobanoglu, M.C., et al. (2015) BalestraWeb: efficient online evaluation of drug-target interactions. Bioinformatics, 31(1), 131-133.
Huntley, R.P., et al. (2015) The GOA database: gene Ontology annotation updates for 2015. Nucleic Acids Res, 43, D1057-D1063.
Kanehisa, M., et al. (2017) KEGG: new perspectives on genomes, pathways, diseases and drugs. Nucleic Acids Res, 45(D1), D353-D361.
Knox, C., et al. (2011) DrugBank 3.0: a comprehensive resource for 'omics' research on drugs. Nucleic Acids Res, 39:D1035-D1041.
Li, Y.H., et al. (2018) Therapeutic target database update 2018: enriched resource for facilitating bench-to-clinic research of targeted therapeutics. Nucleic Acids Res, 46(D1), D1121-D1127.
Mendez, D., et al. (2019) ChEMBL: towards direct deposition of bioassay data. Nucleic Acids Res, 47(D1), D930-D940.
Szklarczyk, D., et al. (2016) STITCH 5: augmenting protein-chemical interaction networks with tissue and affinity data. Nucleic Acids Res, 44(D1), D380-D384.
The UniProt, C. (2017) UniProt: the universal protein knowledgebase. Nucleic Acids Res, 45(D1), D158-D169.
Wishart, D.S., et al. (2018) DrugBank 5.0: a major update to the DrugBank database for 2018. Nucleic Acids Res, 46(D1), D1074-D1082.