
|
|
Tutorial for QuartataWeb
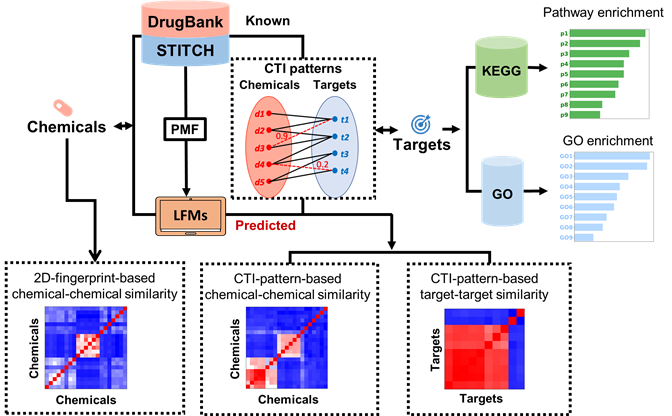
The QuartataWeb is an integrated chemogenomics server for searching and inferring drug-target interactions, target-pathway associations and drug-pathway associations. In chemogenomics-based drug discovery process, the molecular basis of a desired phenotype is unknown, large collections of compounds are screened for the identification of biologically active compounds and targets for the phenotype of interest. These biologically active compounds or targets can provide important biological and pharmaceutical insights about the phenotype. There’s a need for comprehensive and integrated computational tools which can efficiently mine and predict drug-target-pathway associations. QuartataWeb server addresses this problem by integrating drug-target interaction prediction, pathway inference and enrichment analysis. QuartataWeb contains up to 16,047 drug-target interactions and 5.4 million chemical-protein interactions, the predicted probabilities of the interactions between 15 million drug-target pairs and 2.98 billion chemical-protein pairs, and 28,644 gene-pathway associations. With QuartataWeb, users can infer ligands and pathways for a certain target, infer targets and pathways for a certain drug or chemical, or perform enrichment analysis for a list of drugs/targets/drug-drug combinations.
1.1 Query a single chemical and/or target
1.2 Query a list of chemicals/targets/chemical combinations
Chemical-target interaction
2.1 Query a chemical
2.1.1 With secondary interactions
2.1.2 Without secondary interactions
2.2.1 With secondary interactions
2.2.2 Without secondary interactions
2.3 Query a chemical and a target
2.3.1 With secondary interactions
2.3.2 Without secondary interactions
Chemical-chemical similarity
2.4 Query one chemical
2.4.1 With secondary interactions
2.4.2 Without secondary interactions
2.5 Query two chemicals
2.5.1 With secondary interactions
2.5.2 Without secondary interactions
Target-target similarity
2.6.1 With secondary interactions
2.6.2 Without secondary interactions
2.7.1 With secondary interactions
2.7.2 Without secondary interactions
Enrichment analysis of a list of chemicals
Enrichment analysis of a list of targets
Enrichment analysis of a list of chemical combinations
2.10 Query a list of chemical combinations
Before using QuartataWeb, please prepare your query chemicals or targets as follows:
If you query any drug from DrugBank, you can use the following two types of identifiers:
· DrugBank ID in the form like "DB01224", where the first two characters are always "DB" and the remaining numbers identify the specific drug.
· Drug names such as "sunitinib" "atorvastatin", or "aspirin" are also recognized, however the DrugBank ID is the preferred approach.
If you query any drug from STITCH, you can use the Pubchem compound ID in the form like "1224".
If you query any protein, you can use the following three types of identifiers:
· UniprotKB accession number (AC) in the form like “P28566”
· UniprotKB entry name in the form like “5HT1E_HUMAN”
· Gene name in the form like “ADA2A”
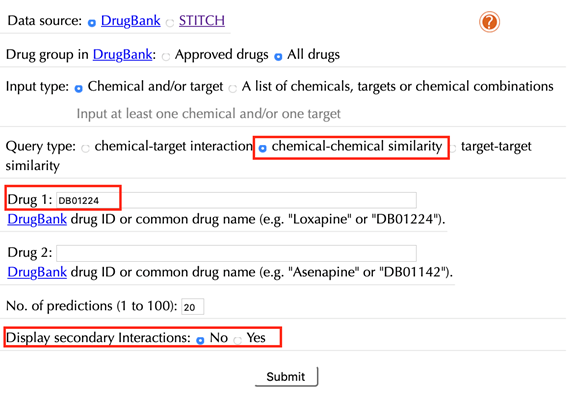
1.1 Query a single chemical and/or target
Select “chemcial and/or target” as the “Input type”:
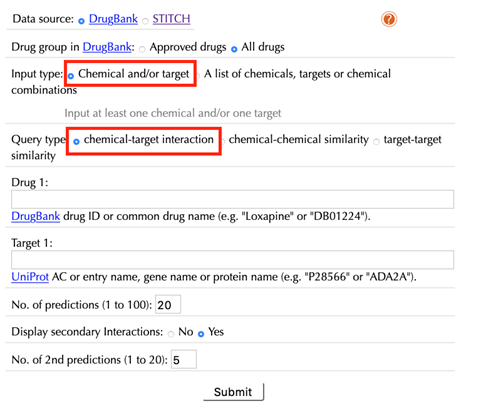
Data Source: DrugBank, STITCH
Select the data source, DrugBank or STITCH.
The default option is “DrugBank”.
Drug group in DrugBank: Approved drugs, All drugs
When DrugBank is selected as the data source, select a dataset from the DrugBank database:
“Approved drugs”: drugs that has been approved in at least one jurisdiction, at some point in time.
“All drugs”: all drugs including approved drugs, veterinarian approved drugs, nutraceutical drugs, illicit drugs, investigational drugs and experimental drugs.
The default option is “All drugs”.
Query type: chemical-target interaction, chemical-chemical similarity, target-target similarity
“chemical-target interaction”: this is the default query type. Select it if a user wants to obtain chemical-target interactions for a queried chemical, a target, or a chemical-target pair.
“chemical-chemical similarity”: select this query type if a user wants to obtain similar chemicals for a queried chemical, or chemical-chemical similarity between two queried chemicals.
“target-target similarity”: select this query type if a user wants to obtain similar targets for a queried target, or target-target similarity between two queried targets.
When choosing “drug-target interaction” as a query type, the following options are displayed:
Drug:
Enter an accepted drug or chemical identifier.
If you merely want to query a target, leave this this space blank.
Target:
Enter UniprotKB ID, or gene name of your queried target.
If you just query a chemical, leave this space blank.
Number of predictions (1 to 100):
Set the number of drug-target interaction predictions from “1” to “100”, the default value is “20”.
Display secondary interactions: No, Yes
The default option is “Yes”, both known and predicted secondary interactions will be displayed. Use “Number of 2nd predictions (1 to 20)” to set the number of predicted secondary interactions, the default value is “5”.
When choosing “chemical-chemical similarity” as a query type, the following options are displayed:
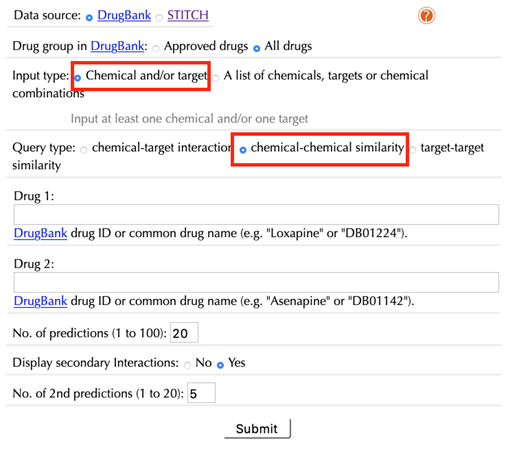
Drug 1/Chemical 1:
Enter an accepted drug or chemical identifier of your queried durg/chemical #1.
Drug 2/Chemical 2:
Enter an accepted drug or chemical identifier of your queried drug/chemical #2.
If you choose to query only one chemical, leave this space blank.
No. of predictions (1 to 100):
Set the number of top similar drugs/chemicals.
Display 2nd predictions: No, Yes
Select “Yes” to display secondary interactions, the default option is “Yes”.
No. of 2nd predictions (1 to 20):
Set the number of predicted secondary interactions, the default value is “5”.
The usage of the “target-target similarity” query type is the same as that of the “chemical-chemical similarity”, enter target identifiers in the corresponding “target 1” and/or “target 2” space.
1.2 Query a list of chemicals/targets/chemical combinations
Select “A list of chemicals/targets/chemical combinations” as the “Input type”:
Data Source: DrugBank, STITCH
Select the data source, DrugBank or STITCH.
The default option is “DrugBank”.
Drug group in DrugBank: Approved drugs, All drugs
Select a dataset from the DrugBank database:
“Approved drugs”: drug that has been approved in at least one jurisdiction, at some point in time.
“All drugs”: all drugs including approved drugs, veterinarian approved drugs, nutraceutical drugs, illicit drugs, investigational drugs and experimental drugs.
The default option is “All drugs”.
Query type: Chemicals, Targets, Chemical combinations
Chemicals: the default query type, select this if a user wants to perform target and pathway enrichment analysis for a list of drugs/chemicals.
Targets: select this if a user wants to perform drug and pathway enrichment analysis for a list of targets.
Chemical combinations: select this if a user wants to analyze the shared targets and shared pathways for a list of chemical combinations.
When choosing “Drugs” (“Chemicals” for STITCH) as a query type, the following options are displayed:
Drugs:
Enter a list of accepted drug or chemical identifiers. One drug or chemical per line.
When choosing “Targets” as a query type, the following options are displayed:
Targets:
Enter UniprotKB IDs, gene names of your queried targets, one target per line.
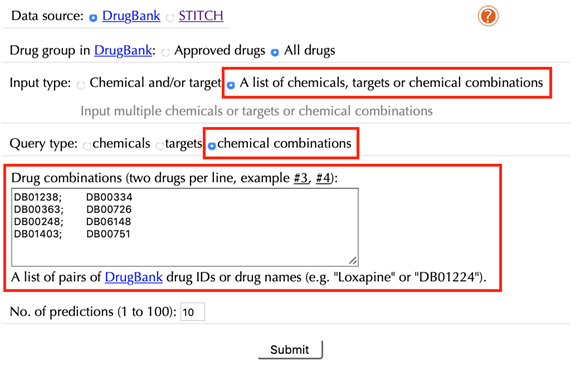
Chemical combinations:
Drug pairs (Chemical pairs for STITCH):
Enter a list of drug-drug/chemical-chemcial combination pairs, using accepted drug or chemical identifiers, two drugs/chemicals per line.
No. of predictions (1 to 100):
Set the number of chemical-target interaction predictions for each queried drug/chemical or target from “1” to “100”, the default value is “10”.
Chemical-target interaction
2.1 Query a chemical
2.1.1 With secondary interactions
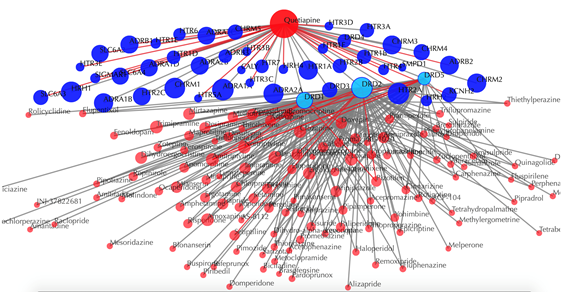
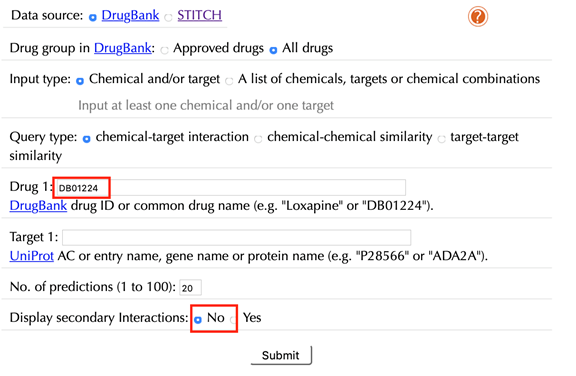
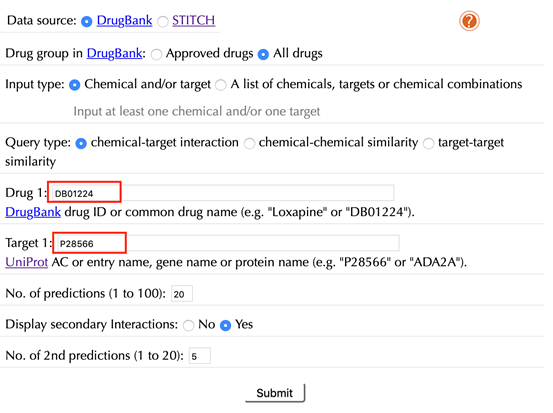
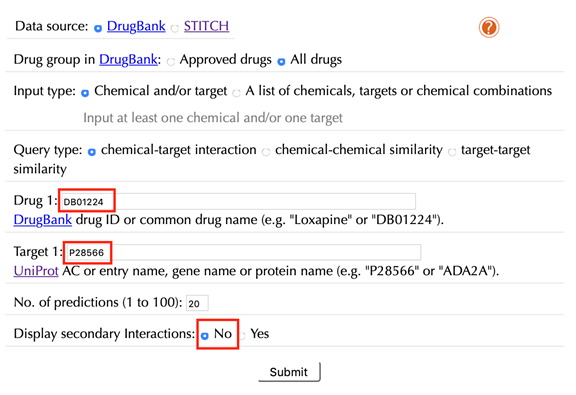
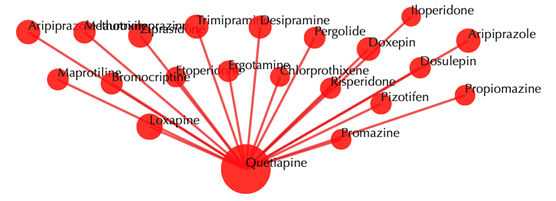
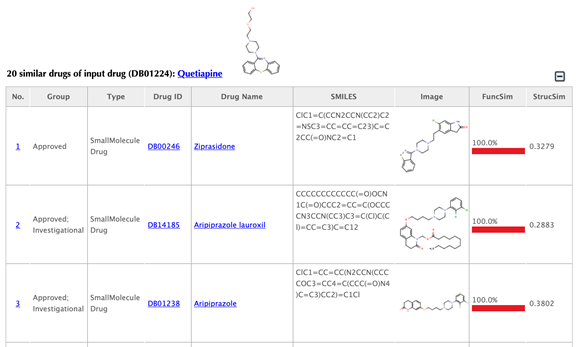
Enter "Quetiapine" or "DB01224" in the “Drug 1” box, leave other settings as default:
Click the “Submit” button and within a few seconds you will be led to a results page.
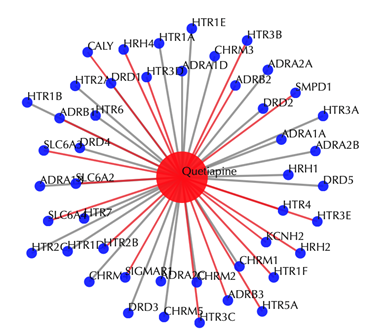
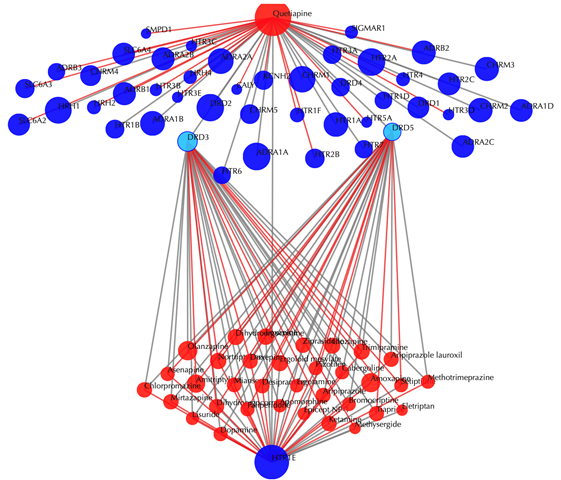
Drug-target interaction network
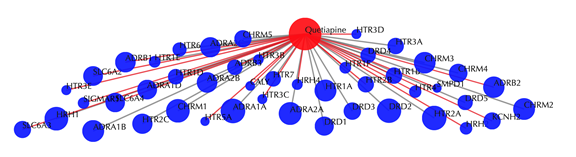
Drug-target interaction network
Red node: input drug, blue nodes: targets, grey edges: known interactions, red edges: predicted interactions. The labels of drug nodes are the common names of the drugs and the labels of the target nodes are the gene names of the targets. Users are free to drag the nodes from this interactive network window.
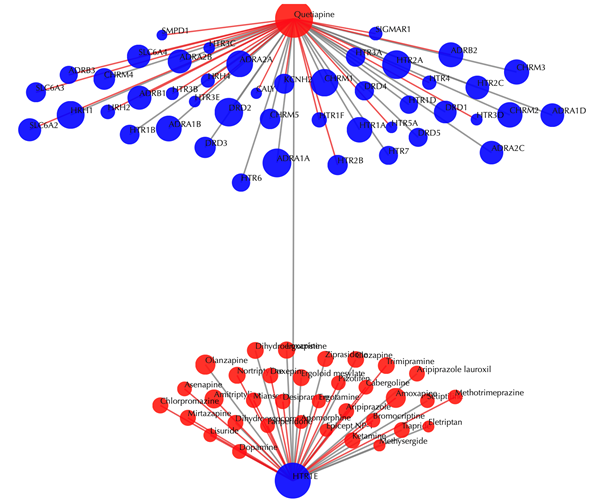
Click on any target nodes to get secondary interactions. For example, clicking on the node “DRD1” displays all the drugs that interact with DRD1:
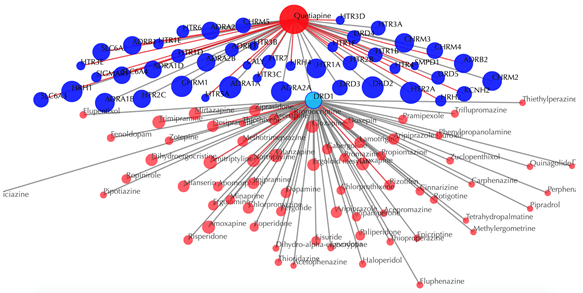
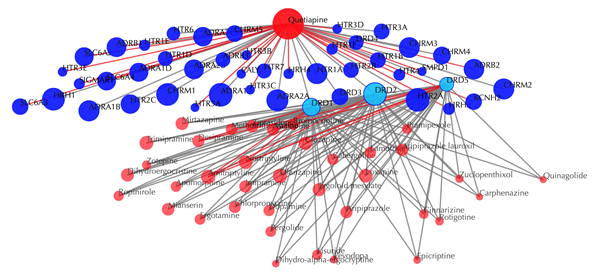
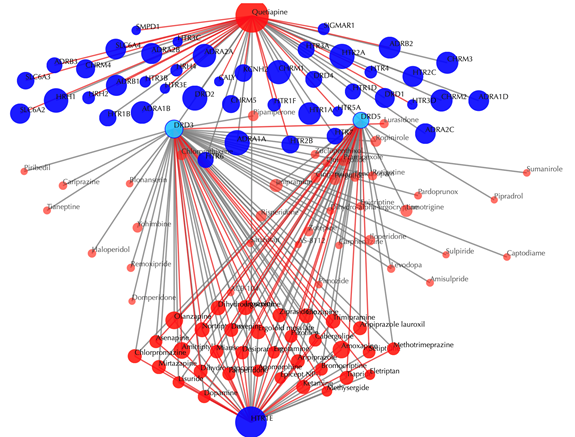
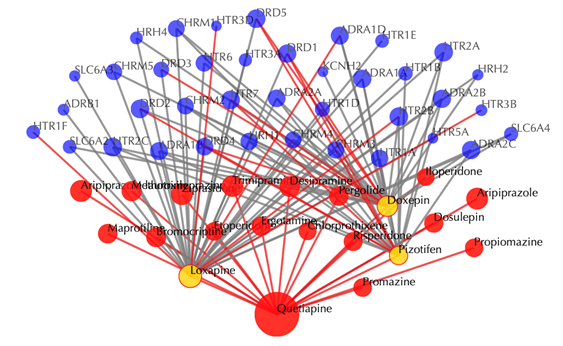
Click on multiple target nodes to get secondary interactions. For example, clicking on nodes “DRD1”, “DRD2”, and “DRD5” displays all the drugs that interact with these targets:
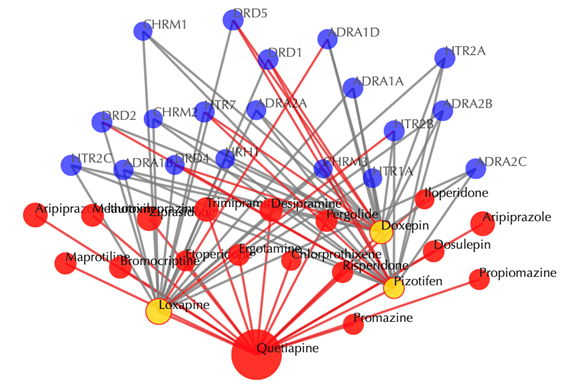
Click on the![]() button to hide the
secondary nodes with edges less than a certain number. For example, the
following figure hides the secondary nodes with edges less than 3:
button to hide the
secondary nodes with edges less than a certain number. For example, the
following figure hides the secondary nodes with edges less than 3:
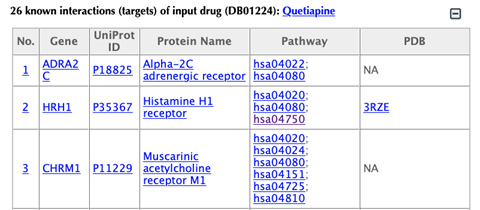
Information of the input drug
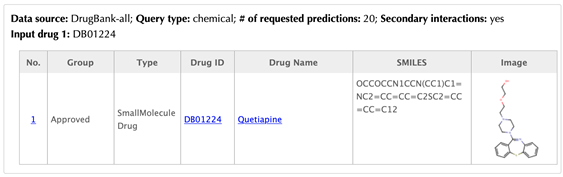
Table of the known targets of the input drug
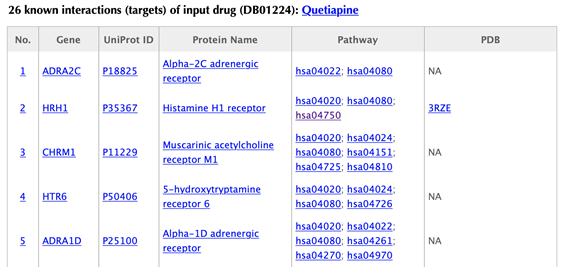
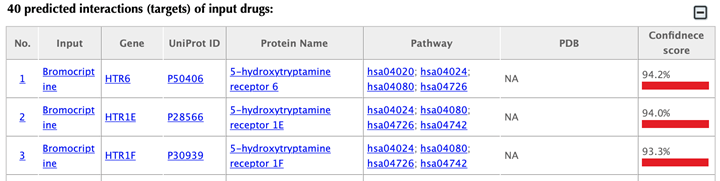
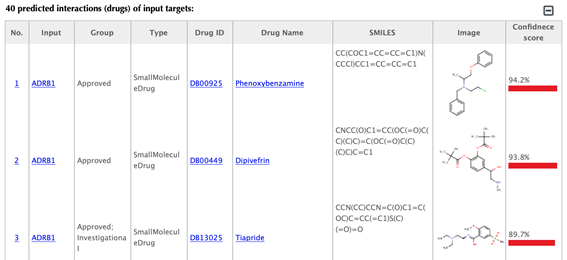
Table of the predicted targets of the input drug
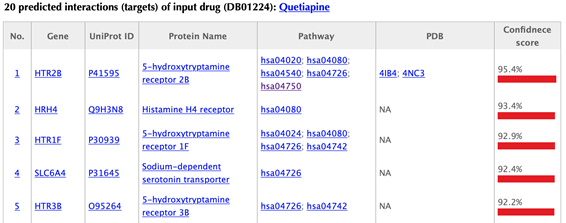
In the target tables, target index, gene name, uniport id, protein name, pathways, PDBs and confidence score for predicted targets are listed in separate columns:
Target index: for the known targets, the indexes are randomly given, while the indexes for the predicted targets are ranked by the predicted interaction confidence scores. Click on the hyperlink of each index, you will be led to the result page of querying the corresponding target. For example, clicking on “1” leads to the result page of querying ADRA2C.
Gene name: gene name of the target. Click on the hyperlink of each gene name and you will be led to the corresponding target page in DrugBank.
Uniprot ID: uniport ID of the target in Uniprot database. Click on the hyperlink of each Uniprot ID and you will be led to the corresponding protein page in Uniport.
Protein name: common protein name on uniprot page. Click on the hyperlink of each protein name and you will be led to the corresponding protein page in Uniport.
Pathway: pathway ID in KEGG database. Click on the hyperlink of each pathway and you will be led to the corresponding pathway page in KEGG.
PDB ID: structure information of the target. Click on the hyperlink of each PDB ID and you will be led to the corresponding PDB page in PDB database.
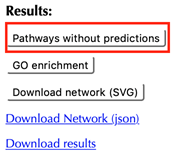
Pathway network
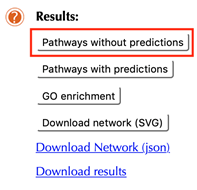
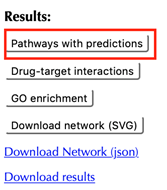
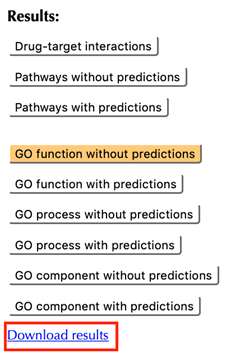
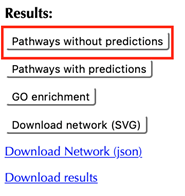
There is a “Pathway without predictions” button on the right-hand side, click on it to enter the pathway results page.
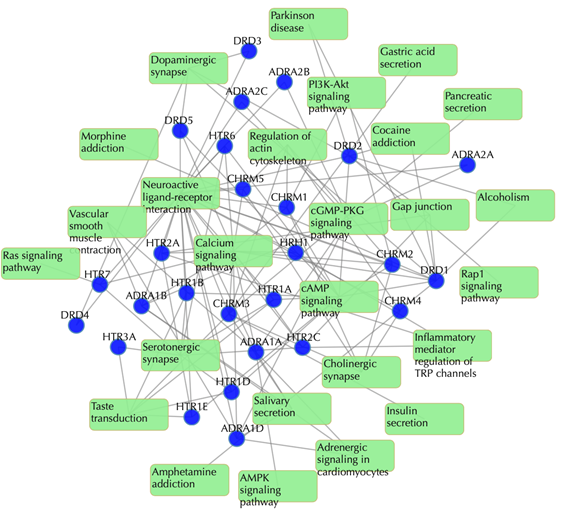
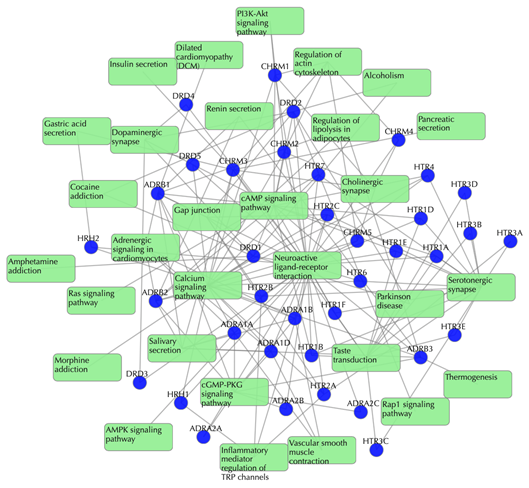
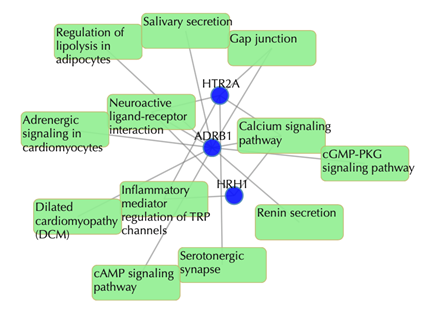
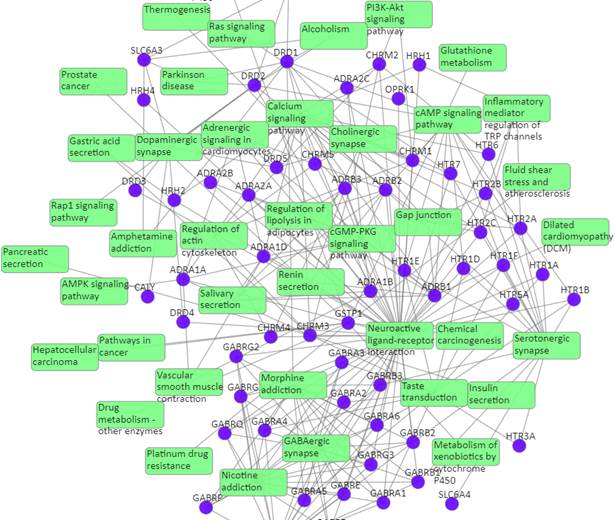
Target-pathway network
Light green rectangle: pathway; blue sphere: target; grey edges: target-pathway associations. A target node is connected to a pathway node if the target is mapped to that pathway.
This network shows the known targets-pathway associations. Click on one node or multiple nodes will fade out those nodes that are not connected to the selected node or nodes. For example, clicking on “DRD1” fades out those nodes that are not connected to the node “DRD1”:
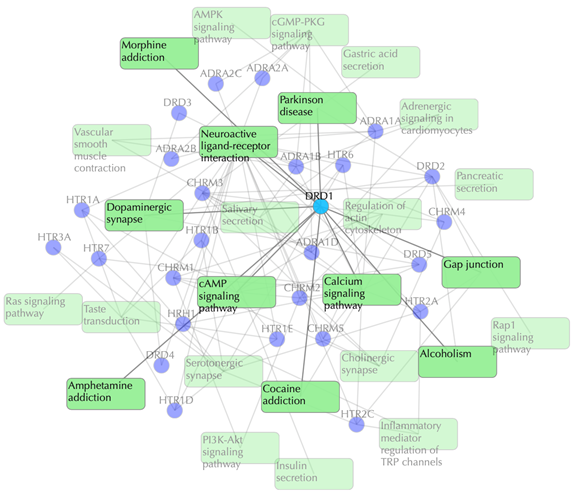
Table of known pathways of the input drug shows the mapped pathways for the input drug based on known drug-target interactions.
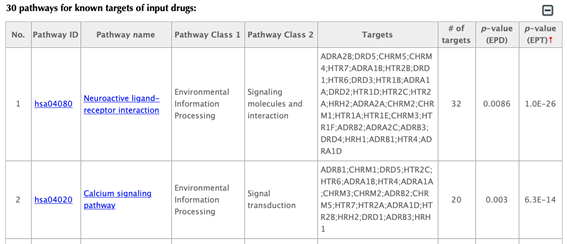
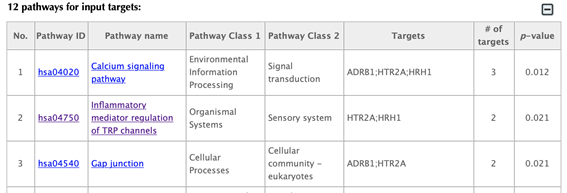
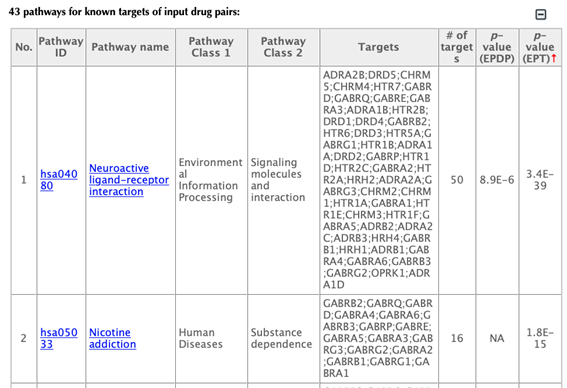
In the pathway tables, index, pathway ID, pathway name, pathway class 1, pathway class 2, targets, number of targets, p-value enriched in the input drug and p-value enriched in the target list are all listed. If you click on a certain column header, it will sort the table by that column.
Pathway ID or pathway name: click on the hyperlink of each pathway ID or pathway name and you will be led to the corresponding pathway page in KEGG.
Pathway class: pathway class 1 and pathway class 2 are based on the BRITE hierarchy in KEGG database. Pathway class 1 is the first layer classification and pathway class 2 is the second layer.
Targets: list the gene names of the drug targets that are mapped in the corresponding pathway.
Number of targets: count the number of targets that are mapped in the corresponding pathway.
p-value enriched in the input drug (PED): evaluating if the pathway is enriched given the input drug, using hypergeometric test with FDR correction.
p-value enriched in the target list (PET): evaluating if the pathway is enriched given the list of targets, using hypergeometric test with FDR correction.
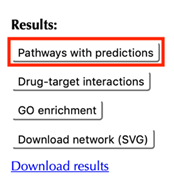
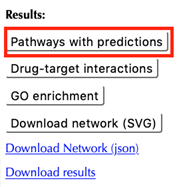
Click on the “Pathways with predictions” button and additional predicted targets appear on the target-pathway network.
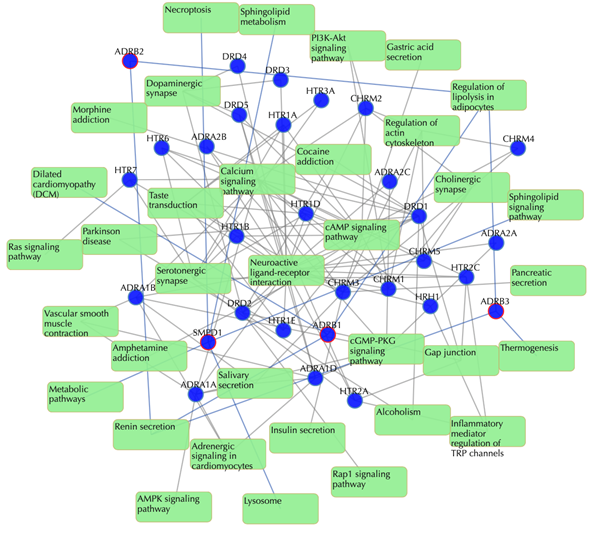
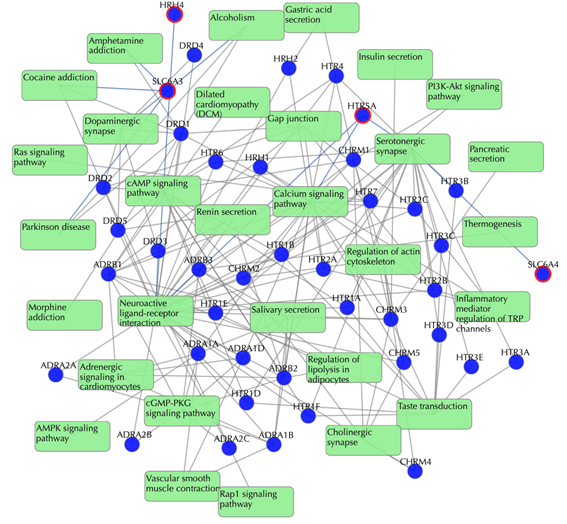
Target-pathway network (both known and predicted targets)
Light green rectangle: pathway; blue sphere: known target; blue sphere with red circle: predicted target; grey edges: target-pathway associations. A target node is connected to a pathway node if the target is mapped to that pathway. This network shows both known and predicted target-pathway associations. Click on one node or multiple nodes will fade out the nodes that are not connected to the selected nodes.
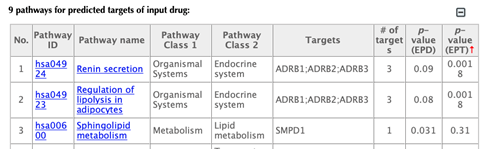
The table of pathways for the predicted targets of the input drug:
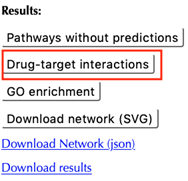
Click on the “Drug-target interactions” button to return to the drug-target interaction results page.
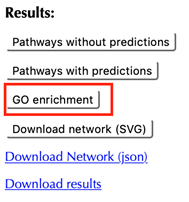
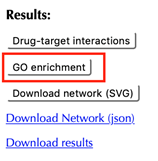
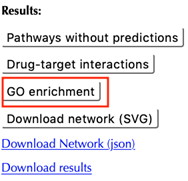
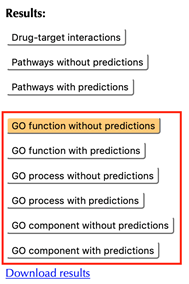
Click on the “GO enrichment” button to go to the GO enrichment results page.
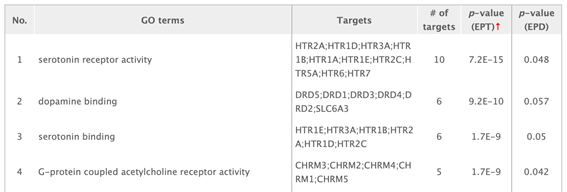
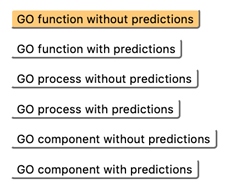
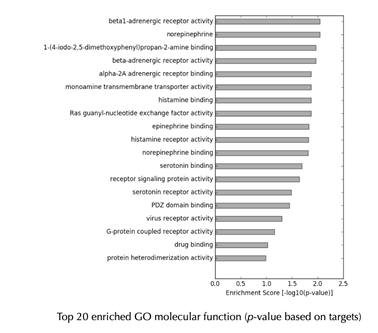
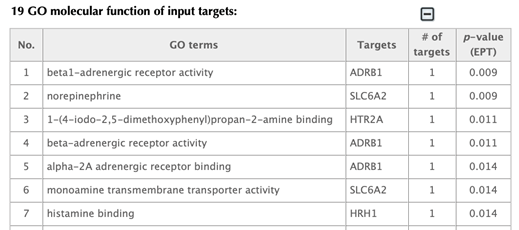
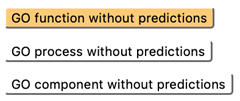
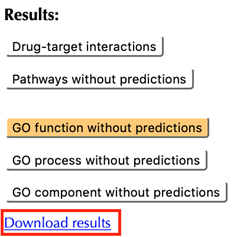
On the GO results page, you can find six buttons for GO results in three different domains (molecular function, biological process and cellular component) with or without predictions. Each page is organized in the same way, we will use the default page “GO function without predictions” as an example to demonstrate.

GO enrichment bar plot
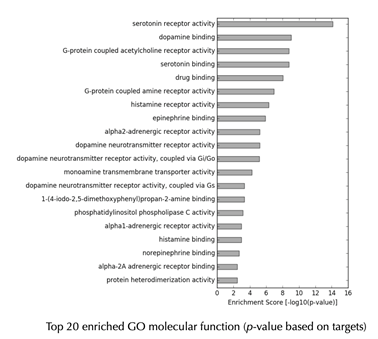
GO enrichment table
Click on the “Download results” hyperlink to download all the result tables.
2.1.2 Without secondary interactions
Enter "Quetiapine" or "DB01224" in the “Drug” box, then click “No” in the “Display secondary interaction”, leave other settings as default:
Click the “Submit” button and within a few seconds you will be led to a results page.
Drug-target interaction network
Drug-target interaction network
Red node: input drug; blue nodes: targets; grey edges: known interactions; red edges: predicted interactions. The labels of the drug nodes are the common names of the drugs, and the labels of the target nodes are the gene names of the targets. Users are free to drag the nodes from this interactive network window.
Target tables and the pathway result page remain the same as querying with secondary interactions.
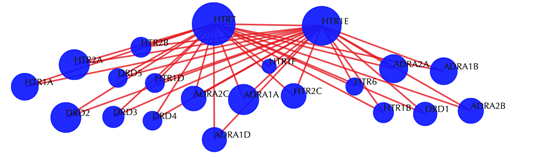
2.2.1 With secondary interactions
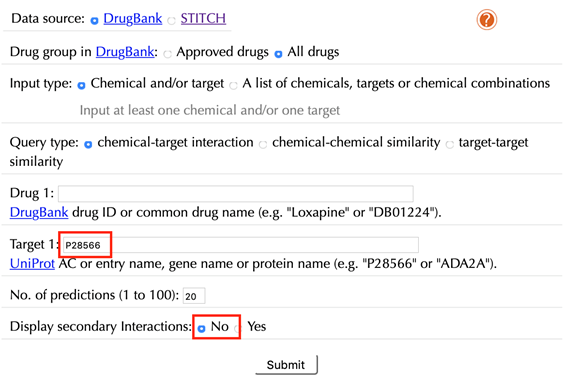
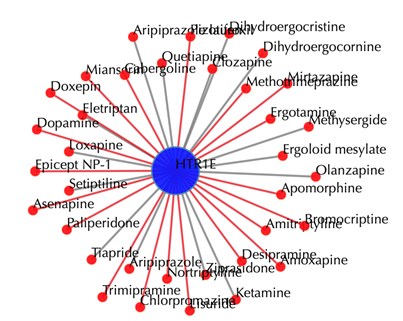
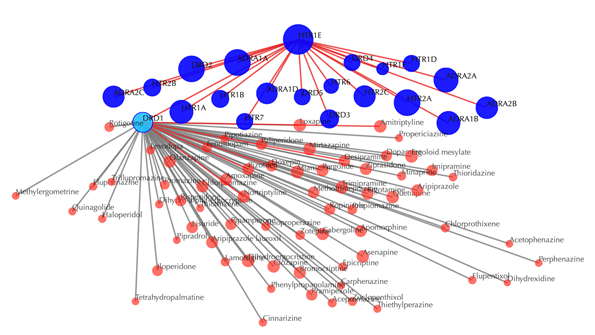
Enter "P28566" in the “Target” box, leave other settings as default:
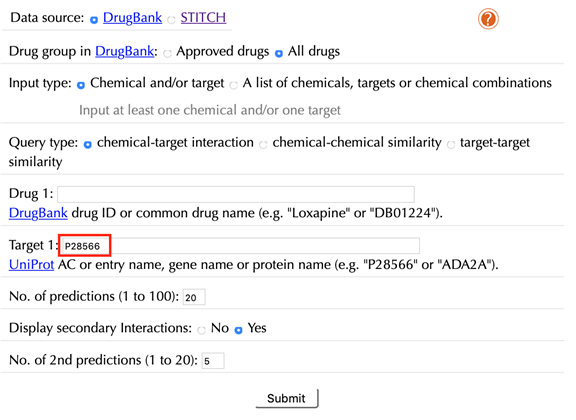
Click the “Submit” button and within a few seconds you will be led to a results page.
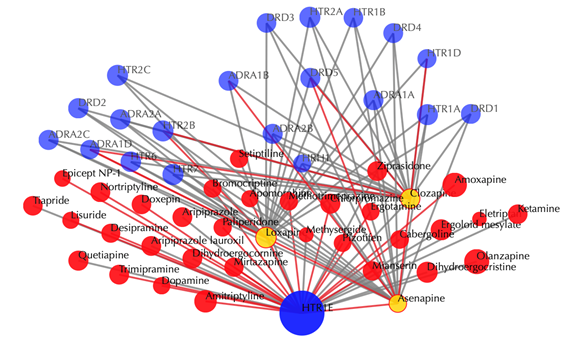
Drug-target interaction network
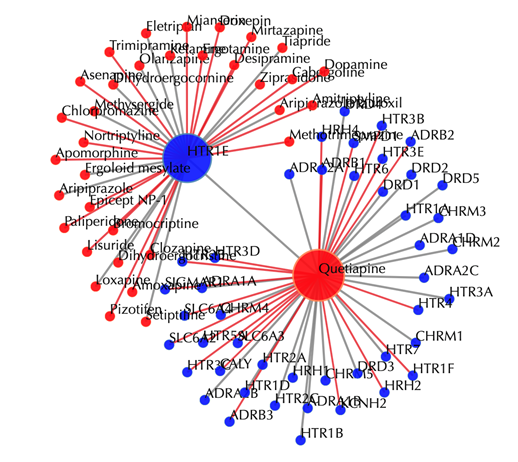
Blue node: input target; red nodes: drugs; grey edges: known interactions; red edges: predicted interactions. The labels of drug nodes are the common names of the drugs and the labels of the target nodes are the gene names of the targets. Users are free to drag the nodes from this interactive network window.
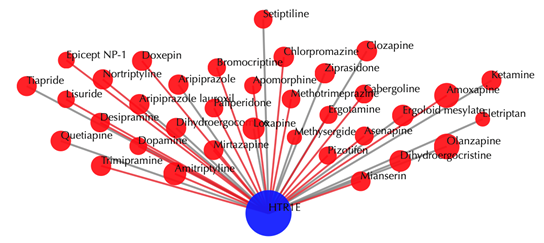
Click on any drug node to get secondary interactions. For example, clicking on node “Loxapine” displays all the targets that interact with Loxapine:
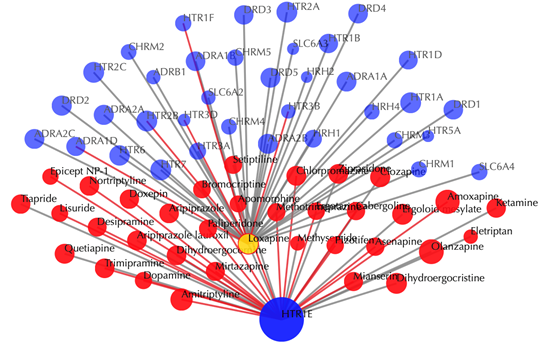
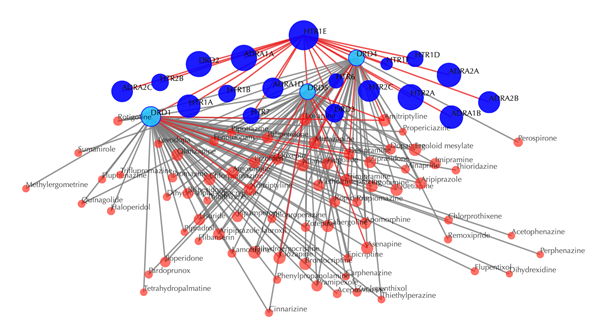
Click on multiple drug nodes to get secondary interactions. For example, clicking on node “Loxapine”, “Asenapine”, “Clozapine” displays all the targets that interact with these drugs:
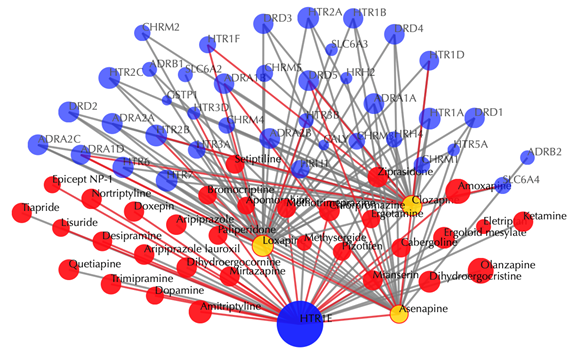
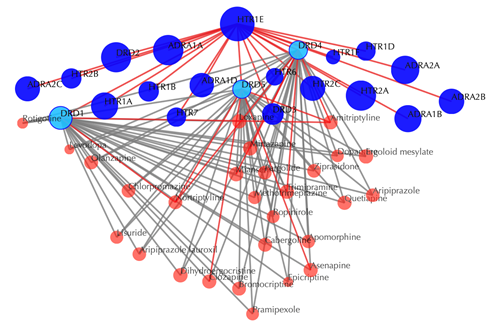
Click on the ![]() button to hide the
secondary nodes with edges less than a certain number. For example, the
following figure hides the secondary nodes with edges less than 3:
button to hide the
secondary nodes with edges less than a certain number. For example, the
following figure hides the secondary nodes with edges less than 3:
Information of the input targetTable of the known drugs of the input target
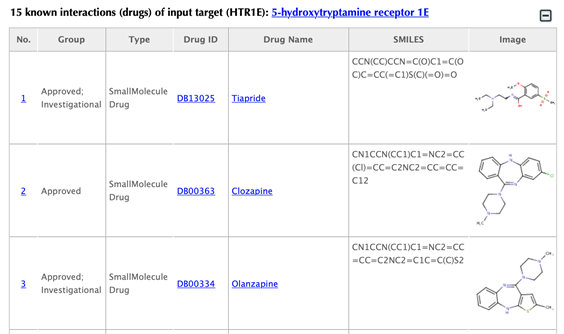
Table of the predicted drugs of the input target
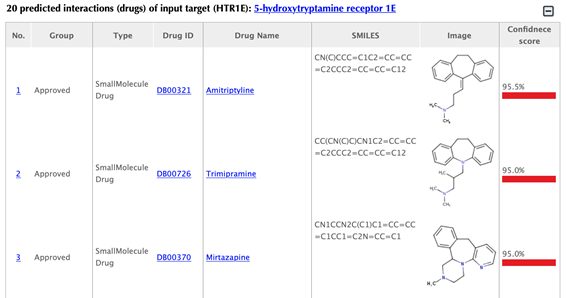
Drug index, drug group, drug type, drug ID, drug name, SMILES, structure image and confidence score for predicted interaction are listed in the drug tables:
Drug group: in DrugBank, drugs are from 6 different groups (approved, experimental, nutraceutical, investigational, withdrawn and illicit).
Drug type: small molecule or biotech.
Drug ID: DrugBank ID, click on the hyperlink of the drug id to get to the corresponding drug page in DrugBank.
Drug name: common name listed in DrugBank, click on the hyperlink of the drug name to get to the corresponding drug page in DrugBank.
SMILES: Isomeric SMILES string corresponding to drug structure.
Image: 2D structure of the drug.
Click “Download results” button on the right side and you can download the tables of known and predicted drugs, as well as pathways for the queried protein.
2.2.2 Without secondary interactions
Enter "P28566" in the “Target” box, click “No” in the “Display secondary interaction”, and leave other settings as default:
Click the “Submit” button and within a few seconds you will be led to a results page.
Drug-target interaction network
Drug-target interaction network
Red node: input drug; blue nodes: targets; grey edges: known interactions; red edges: predicted interactions. The labels of drug nodes are the common names of the drugs, and the labels of the target nodes are the gene names of the targets. Users are free to drag the nodes from this interactive network window.
Drug tables and pathway results page remain the same as querying with secondary interactions.
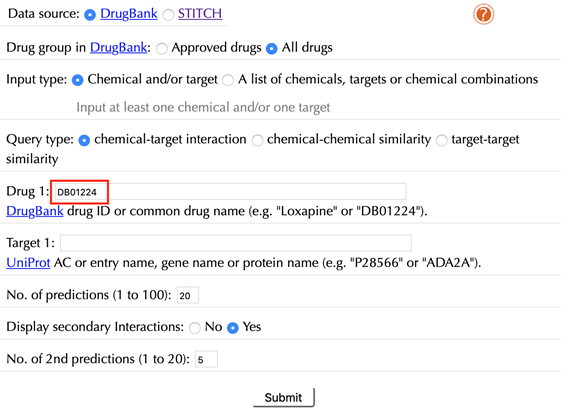
2.3 Query a chemical and a target
2.3.1 With secondary interactions
Enter "DB01224" in the “Drug 1” box, enter "P28566" in the “Target 1” box, and then leave other settings as default:
Click the “Submit” button and within a few seconds you will be led to a results page.
Drug-target interaction network
Drug-target interaction network
Red node: input drug; blue nodes: targets; grey edges: known interactions; red edges: predicted interactions. The labels of the drug nodes are the common names of the drugs and the labels of the target nodes are the gene names of the targets. Users are free to drag the nodes from this interactive network window.
Click on any drug nodes or target nodes to get the secondary interactions:
Click on the ![]() button to hide the
secondary nodes with edges less than a setting number. For example, hide the
secondary nodes with edges less than 3:
button to hide the
secondary nodes with edges less than a setting number. For example, hide the
secondary nodes with edges less than 3:
2.3.2 Without secondary interactions
Enter "DB01224" in the “Drug 1” box, enter "P28566" in the the “Target” box, then click “No” in the “Display secondary interaction”, and leave other settings as default:
Click the “Submit” button and within a few seconds you will be led to a results page.
Drug-target interaction network
Red node: input drug; blue nodes: targets; grey edges: known interactions; red edges: predicted interactions. The labels of the drug nodes are the common names of the drugs and the labels of the target nodes are the gene names of the targets. Users are free to drag the nodes from this interactive network window.
The interaction between the input drug and the input target is listed on the input information section. Other outputs are the same as querying a chemical and a target separately.
Chemical-chemical similarity
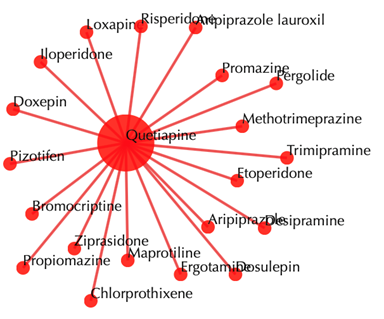
2.4 Query one chemical
2.4.1 With secondary interactions
Select “chemical-chemical similarity” in the “Query type”
Enter an accepted drug identifier in the “Drug 1” box. For example “DB01224”, and leave the other settings as default:
Click the “Submit” button and within a few seconds you will be led to a results page.
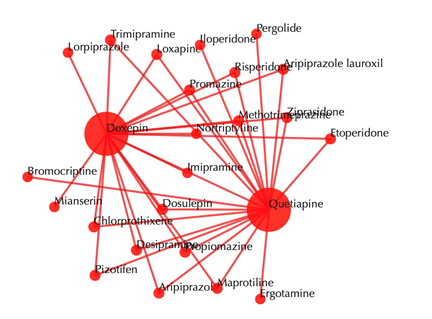
Drug-drug similarity network
Drug-drug similarity network
Red sphere: drug; red edges: cosine similarity between two drugs based on their drug-target interaction patterns. Users are free to drag the nodes from this interactive network window.
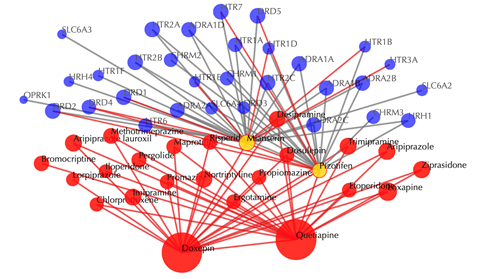
Click on any of the drug nodes to get secondary interactions. For example, clicking on the node “Loxapine” displays all the targets that interact with Loxapine:
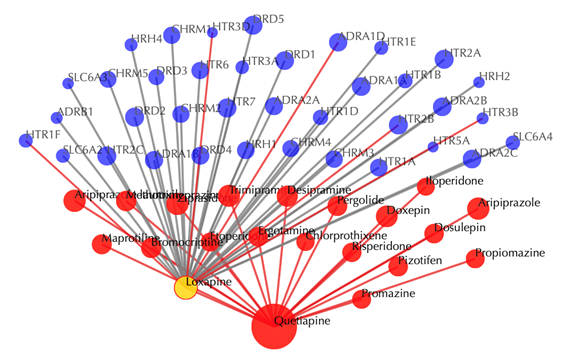
Click on multiple drug nodes to get secondary interactions. For example, clicking on the nodes “Loxapine”, “Doxepine” and “Pizotifen” displays all the targets that interact with these drugs:
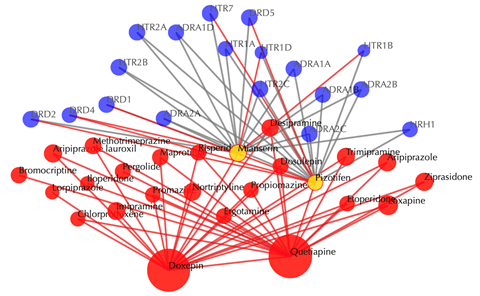
Click on the ![]() button to hide the
secondary nodes with edges less than a certain number. For example, the
following figure hides the secondary nodes with edges less than 3:
button to hide the
secondary nodes with edges less than a certain number. For example, the
following figure hides the secondary nodes with edges less than 3:
Input drug information
Table of similar drugs
Drug index, drug group, drug type, drug ID, drug name, SMILES, structure image and function similarity, and 2D similarity are listed in the drug tables:
Drug group: in DrugBank, drugs are from 6 different groups (approved, experimental, nutraceutical, investigational, withdrawn and illicit).
Drug type: small molecule or biotech.
Drug ID: DrugBank ID, click on the hyperlink of the drug id to get to the corresponding drug page in DrugBank.
Drug name: common name listed in DrugBank, click on the hyperlink of the drug name to get to the corresponding drug page in DrugBank.
SMILES: Isomeric SMILES string corresponding to drug structure.
Image: 2D structure of the drug.
Function similarity: cosine similarity between the two latent vectors of a pair of drugs, indicating the similarity based on drug-target interaction patterns.
Structure similarity: similarity between the 2D structure fingerprints of a pair of drugs, indicating the structure similarity.
Click the “Download results” button on the right side and you can download the table of similar drugs as well as the tables of secondary interactions.
2.4.2 Without secondary interactions
Enter " DB01224" in the “Drug 1” box, click “No” in the “Display secondary interaction”, leave other settings as default:
Click the “Submit” button and within a few seconds you will be led to a results page.
Drug-drug similarity network
Drug-drug similarity network
Red sphere: drug; red edges: cosine similarity between two drugs based on their drug-target interaction patterns. Users are free to drag the nodes from this interactive network window.
Other results are in the same format as querying with secondary interactions.
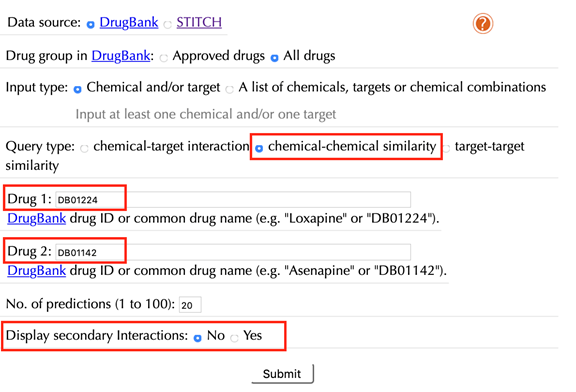
2.5.1 With secondary interactions
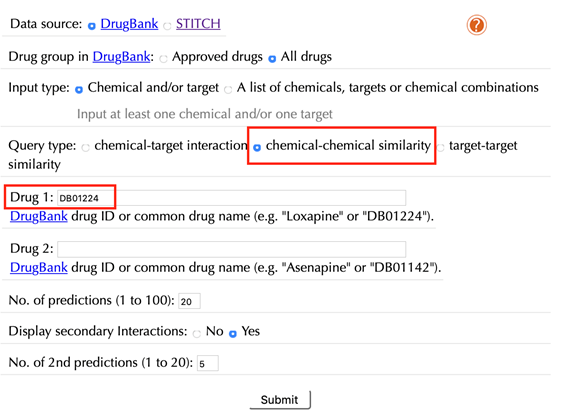
Select “chemical-chemical similarity” in the “Query type”
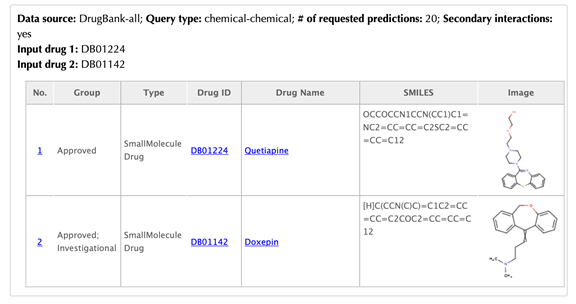
Enter the accepted drug identifiers in the “Drug 1” and the “Drug 2” boxes. For example, “DB01224” and “DB01142”, leave the other settings as default:
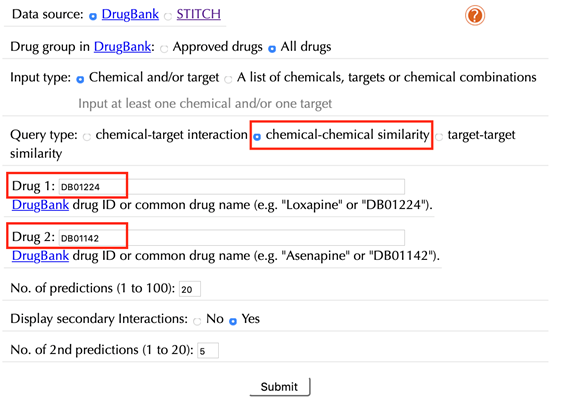
Click the “Submit” button and within a few seconds you will be led to a results page.
Drug-drug similarity network
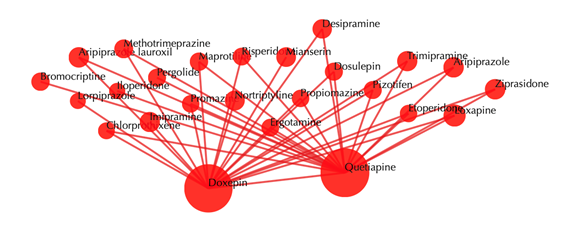
Drug-drug similarity network
Red sphere: drug; red edges: cosine similarity between two drugs based on their drug-target interaction patterns. Users are free to drag the nodes from this interactive network window.
Click on any drug nodes to get secondary interactions.
Click on the ![]() button to hide the
secondary nodes with edges less than a setting number.
button to hide the
secondary nodes with edges less than a setting number.
Information of the input drugs
There are two tables list the similar drugs for each input drug separately, the table format is the same as querying one drug.
Click the “Download results” button on the right side you can download the tables of similar drugs for each input drug.
2.5.2 Without secondary interactions
Enter drug IDs or common drug names in the “Drug 1” and the “Drug 2” boxes. For example, “DB01224” and “DB01142”, click “No” in the “Display secondary interaction”, leave other settings as default:
Click the “Submit” button and within a few seconds you will be led to a results page.
Drug-drug similarity network
Red sphere: drug; red edges: cosine similarity between two drugs based on their drug-target interaction patterns. Users are free to drag the nodes from this interactive network window.
Other outputs remain the same as querying with secondary interactions.
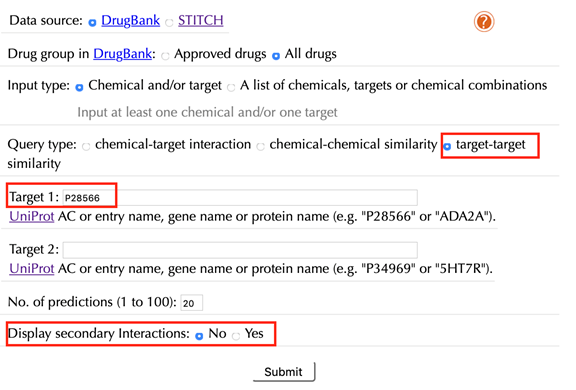
Target-target similarity
2.6.1 With secondary interactions
Select “target-target similarity” in the “Query type”
Enter the Uniprot ID or gene name in the “Target 1” box. For example, enter “P28566” and leave the other settings as default:
Click the “Submit” button and within a few seconds you will be led to a result page.
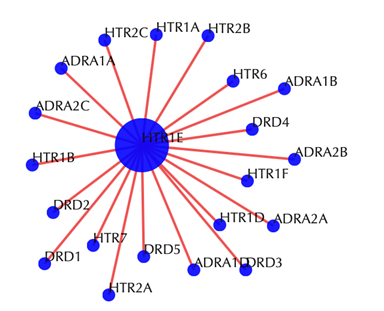
Target-target similarity network
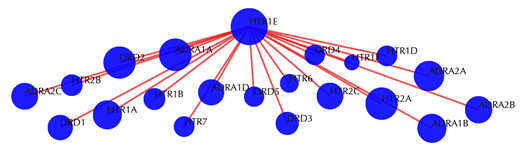
Target-target similarity network
Blue sphere: target; red edges: cosine similarity between two targets based on their drug-target interaction patterns. Users are free to drag the nodes from this interactive network window.
Click on any of the drug nodes to get secondary interactions. For example, clicking on node “DRD1” displays all targets that interact with DRD1:
Click on multiple drug nodes to get secondary interactions. For example, clicking on node “DRD1”, “DRD5”, “DRD4” displays all the drugs that interact with these targets:
Click on the ![]() button to hide the
secondary nodes with edges less than a setting number. For example, the following
figure hides the secondary nodes with edges less than 3:
button to hide the
secondary nodes with edges less than a setting number. For example, the following
figure hides the secondary nodes with edges less than 3:
Information of the input
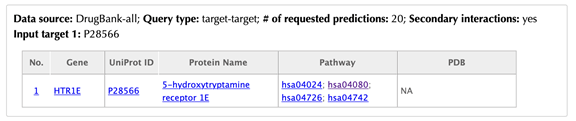
Table of similar targets
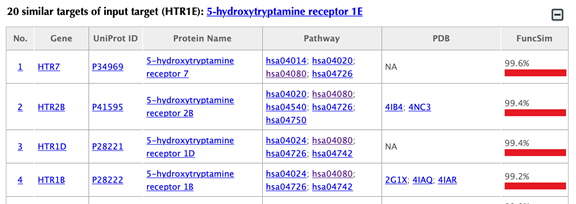
Target index, gene name, Uniprot ID, protein name, pathway, PDB, Function similarity are listed in the target table:
The indexes are ranked by the LV similarities. Click on the hyperlink of each index, for example “1”, you will be led to the results page of querying drug-target interactions of the corresponding target.
Gene name: click on the hyperlink of each gene name and you will be led to the corresponding target page in DrugBank.
Uniprot ID: click on the hyperlink of each Uniprot ID or protein name and you will be led to the corresponding protein page in Uniport.
Pathway: click on the hyperlink of each pathway and you will be led to the corresponding pathway page in KEGG.
PDB ID: click on the hyperlink of each PDB ID and you will be led to the corresponding PDB page in the PDB database.
Function similarity: cosine similarity between the two latent vectors of a pair of drugs, indicating the similarity based on drug-target interaction patterns.
Click the “Download results” button on the right side and you can download the table of similar targets, as well as the tables of secondary interactions.
2.6.2 Without secondary interactions
Select “target-target similarity” in the “Query type”
Enter a Uniprot ID or gene name in the “Target 1” box, for example “P28566”, click “No” in the “Display secondary interaction” and leave other settings as default:
Click the “Submit” button and within a few seconds you will be led to a result page.
Target-target similarity network
Target-target similarity network
Blue sphere: target; red edges: cosine similarity between two targets based on their drug-target interaction patterns. Users are free to drag the nodes from this interactive network window.
Other outputs remain the same as querying with secondary interactions.
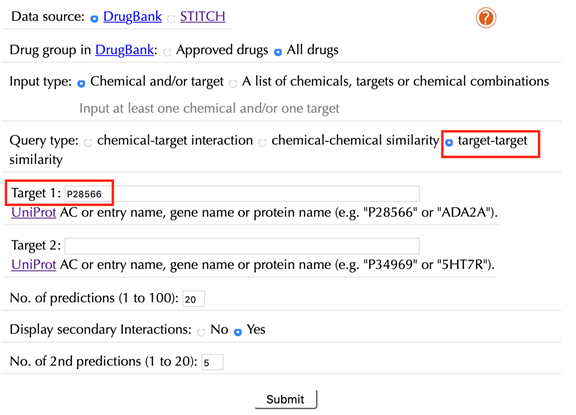
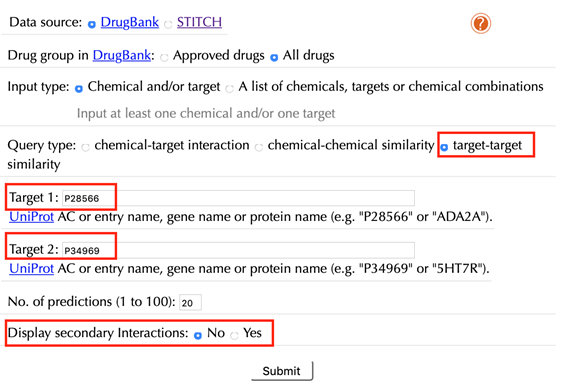
2.7.1 Without secondary interactions
Select “target-target similarity” in the “Query type”
Enter the Uniprot ID or gene name in the “Target 1” box and the “Target 2” box. For example, enter “P28566” and “P34969”, leave the other settings as default:
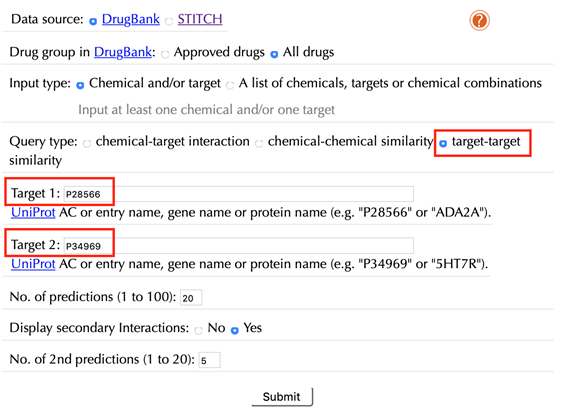
Click the “Submit” button and within a few seconds you will be led to a result page.
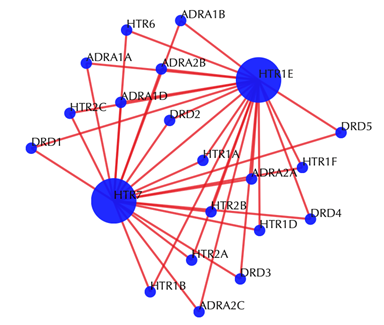
Target-target similarity network
Target-target similarity network
Blue sphere: target; red edges: cosine similarity between two targets based on their drug-target interaction patterns. Users are free to drag the nodes from this interactive network window.
Click on any of the drug nodes to
get secondary interactions, click on ![]() button to hide the secondary
nodes with edges less than a setting number.
button to hide the secondary
nodes with edges less than a setting number.
There are two tables list the similar targets for each input target separately, the table format is the same as querying one target.
Click “Download results” button on the right side you can download the tables of similar targets for each input target.
2.7.2 Without secondary interactions
Select “target-target similarity” in the “Query type”
Enter the Uniprot ID or gene name in the “Target 1” box and the “Target 2” box. For example, enter “P28566” and “P34969”, then click “No” in the “Display secondary interaction”, leave other settings as default:
Click the “Submit” button and within a few seconds you will be led to a results page.
Target-target similarity network
Blue sphere: target; red edges: cosine similarity between two targets based on their drug-target interaction patterns. Users are free to drag the nodes from this interactive network window.
Other outputs remain the same as querying with secondary interactions.
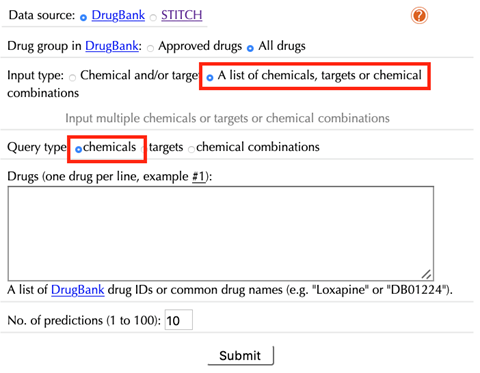
2.8 Query a list of chemicals:
Select “A list of chemicals, targets or chemical combinations” in the “Input type”
Select “chemicals” in the “Query type”
Enter a list of accepted drug identifiers in the “Drugs” box, one drug per line, leave the other settings as default:
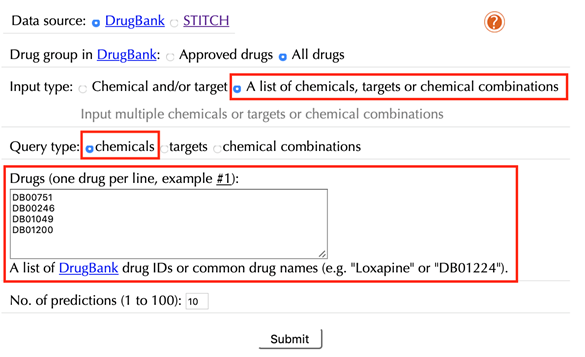
Click the “Submit” button and within a few seconds you will be led to a result page.
Drug-target interaction network
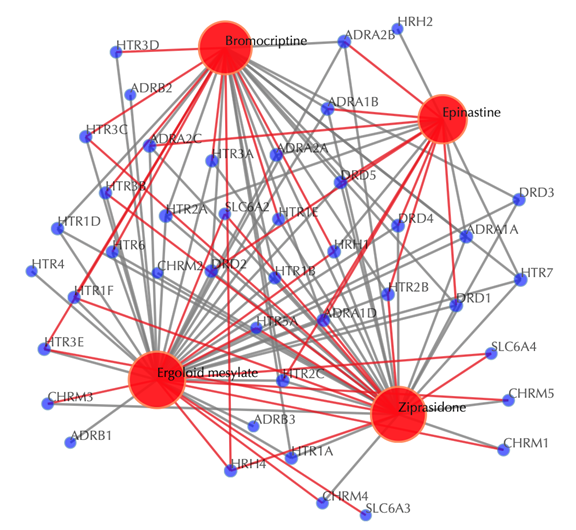
Drug-target interaction network
Red nodes: input drugs; blue nodes: targets; grey edges: known interactions; red edges: predicted interactions. The labels of the drug nodes are the common names of the drugs, and the labels of the target nodes are the gene names of the targets. Users are free to drag the nodes from this interactive network window.
![]()
Click on “Trim 1st generation nodes” button with a cutoff of 4 (select from the neighboring drop-down box), to hide the secondary nodes with edges less than the cutoff number. For example, hide the secondary nodes with edges less than 4. This helps to identify and clearly view the targets which interact with all the 4 input drugs.
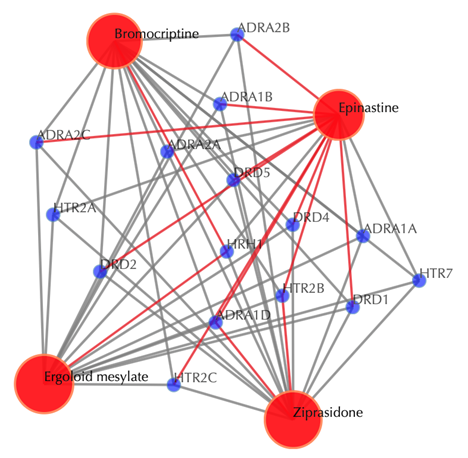
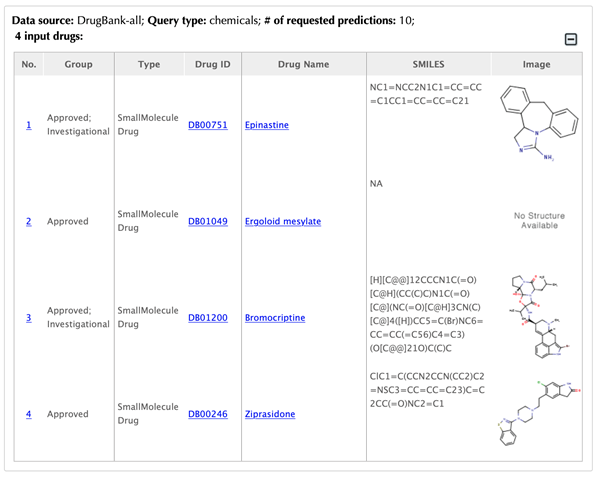
Table of the input drugs
Drug-drug similarity plots
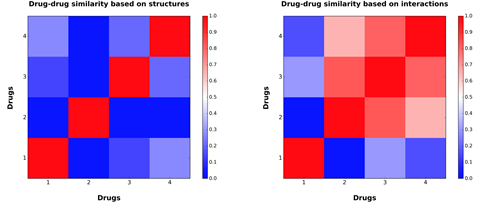
Table of the known interactions of the input drugs
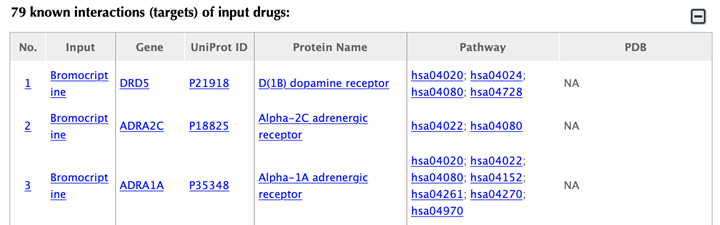
Table of the predicted interactions of the input drugs
In the interaction tables, drug-target interaction index, drug name, gene name, uniport id, protein name, pathways, PDBs, and confidence score for predicted targets are listed in separate columns:
Drug-target interaction index: for the known interactions, the indexes are randomly given. For the predicted interactions, the indexes are ranked by the predicted interaction confidence scores.
Gene name: gene name of the target. Click on the hyperlink of each gene name and you will be led to the corresponding target page in DrugBank.
Uniprot ID: uniport ID of the target in the Uniprot database. Click on the hyperlink of the Uniprot ID and you will be led to the corresponding protein page in Uniport.
Protein name: common protein name in Uniprot database. Click on the hyperlink of the protein name and you will be led to the corresponding protein page in Uniport.
Pathway: pathway ID in the KEGG database. Click on the hyperlink of the pathway ID and you will be led to the corresponding pathway page in KEGG.
PDB ID: PDB IDs of the target structure in the PDB database. Click on the hyperlink of each PDB ID and you will be led to the corresponding PDB page in the PDB database.
Click on the “Pathways without predictions” button on the right-hand side and you will be led to the pathway result page.
Pathway network
Target-pathway network
Light green rectangle: pathway; blue sphere: target; grey edges: target-pathway associations. A target node is connected to a pathway node if the target is mapped to that pathway.
This network shows the known targets-pathway associations. Click on one node or multiple nodes will fade out the nodes that are not connected to the selected nodes.
Table of known pathways of the input drugs shows the mapped pathways for the input drugs based on known drug-target interactions.
In the pathway tables, index, pathway ID, pathway name, pathway class 1, pathway class2, targets, number of targets, p-value enriched in the input drugs, and p-value enriched in the target list are listed. If you click on a certain column header, it will sort the table by that column.
Pathway ID or pathway name: click on the hyperlink of each pathway ID or pathway name and you will be led to the corresponding pathway page in KEGG.
Pathway class: pathway class 1 and pathway class 2 are based on the BRITE hierarchy in KEGG database. Pathway class 1 is the first layer classification, and pathway class 2 is the second layer.
Targets: list the gene names of the drug targets that are mapped in the corresponding pathway.
Number of targets: count the number of targets that are mapped in the corresponding pathway.
p-value enriched in the input list of drugs (PED): evaluating if the pathway is enriched given the input list of drugs, using hypergeometric test with FDR correction.
p-value enriched in the target list (PET): evaluating if the pathway is enriched given the list of targets, using hypergeometric test with FDR correction.
Click on the “Pathways with predictions” button, additional predicted targets appeal on the target-pathway network.
Target-pathway network (both known and predicted targets)
Light green rectangle: pathway; blue sphere: known target; blue sphere with red circle: predicted target; grey edges: target-pathway associations. A target node is connected to a pathway node if the target is mapped to that pathway. This network shows target-pathway associations for both known and predicted targets. Click on one node or multiple nodes will fade out the nodes that are not connected to the selected nodes.
Click on the “Drug-target interactions” button to return to the drug-target interaction result page.

Click on the “GO enrichment” button and you will be led to the results page of biological function GO enrichment without predictions.
GO enrichment bar plots
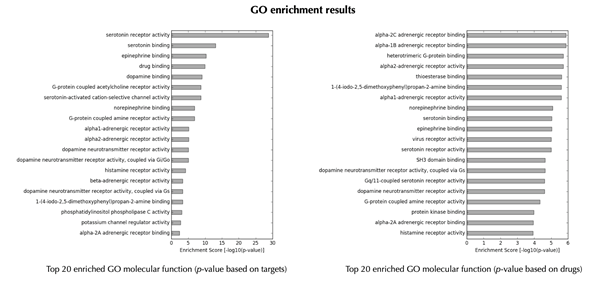
GO enrichment table
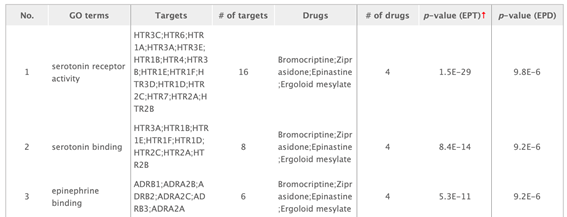
Click on the one of the other GO enrichment buttons and you will be led to corresponding GO enrichment results page in the same format.
Click on the “Download results” hyperlink to download all the result tables.
Select “A list of chemicals, targets or chemical combinations” in the “Input type”
Select “targets” in the “Query type”
Enter a list of accepted target identifiers in the “Targets” box, one target per line, leave the other settings as default:
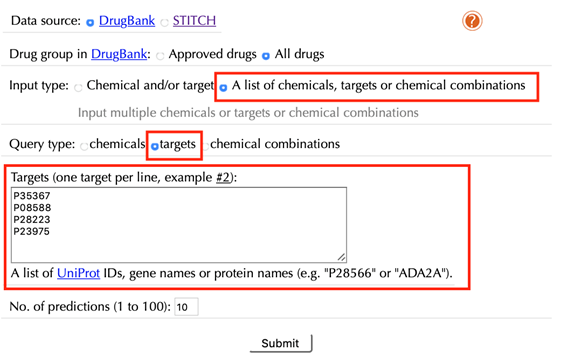
Click the “Submit” button and within a few seconds you will be led to a results page.
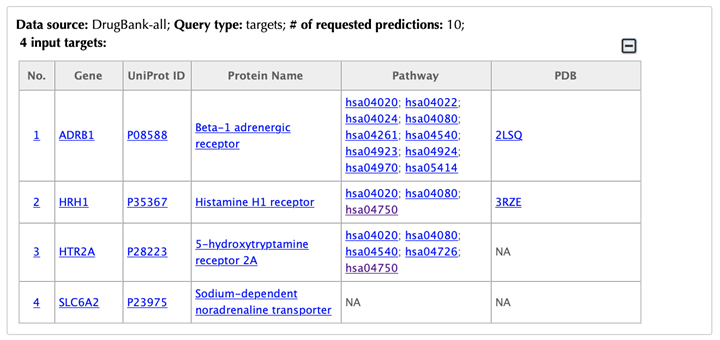
Table of the input targets
Drug-target interaction network
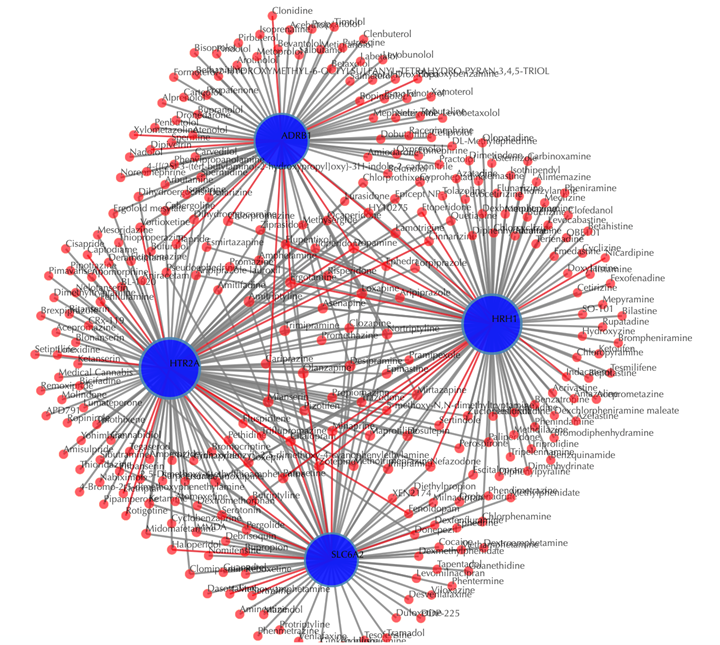
Drug-target interaction network
Red nodes: drugs; blue nodes: targets; grey edges: known interactions; red edges: predicted interactions. The labels of the drug nodes are the common names of the drugs, and the labels of the target nodes are the gene names of the targets. Users are free to drag the nodes from this interactive network window.
Click on the “Trim 1st generation nodes” button with a cutoff of 4, (select from the neighboring drop-down box), to hide the secondary nodes with edges less than the cutoff number. For example, hide the secondary nodes with edges less than 4. This helps to identify and clearly view the drugs which interact with all the 4 input targets.
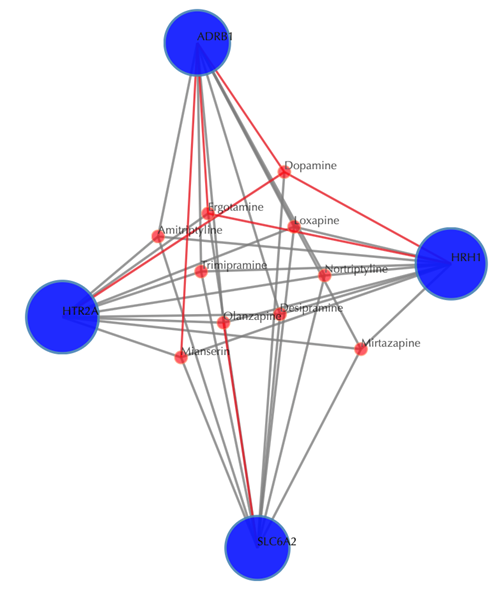
Table of the known interactions of the input targets
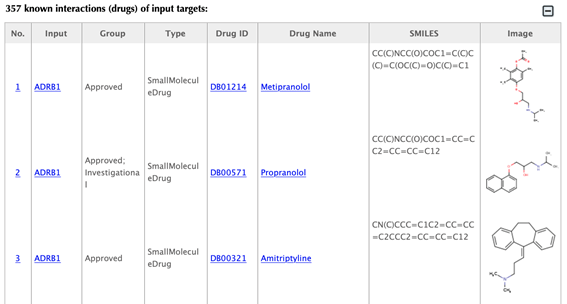
Table of the predicted interactions of the input targets
Drug-target interaction index, target gene name, drug group, drug type, drug ID, drug name, SMILES, structure image, and confidence score for predicted interaction are listed in the interaction tables.
Drug group: in DrugBank, drugs are from 6 different groups (approved, experimental, nutraceutical, investigational, withdrawn and illicit).
Drug type: small molecule or biotech.
Drug ID: DrugBank ID, click on the hyperlink of the drug id to get to the corresponding drug page in DrugBank.
Drug name: common name listed in DrugBank, click on the hyperlink of the drug name to get to the corresponding drug page in DrugBank.
SMILES: isomeric SMILES string corresponding to drug structure.
Image: 2D structure of the drug.
Pathway network
Click on “Pathway without predictions” button on the right-hand side, and enter the pathway result page.
Target-pathway network
Light green rectangle: pathway; blue sphere: target; grey edges: target-pathway associations. A target node is connected to a pathway node if the target is mapped to that pathway.
This network shows the target-pathway associations, click on one node or multiple nodes will fade out those nodes that are not connected to the selected nodes.
Table of pathways of the input targets: shows the mapped pathways for the input targets.
In the pathway table, index, pathway ID, pathway name, pathway class 1, pathway class2, targets, number of targets, p-value enriched in the target list are listed. If you click on a certain column header, it will sort the table by that column.
Pathway ID or pathway name: click on the hyperlink of each pathway ID or pathway name and you will be led to the corresponding pathway page in KEGG.
Pathway class: pathway class 1 and pathway class 2 are based on the BRITE hierarchy in the KEGG database. Pathway class 1 is the first layer classification, and pathway class 2 is the second layer.
Targets: list the gene names of the drug targets that are mapped in the corresponding pathway.
Number of targets: count the number of targets that are mapped in the corresponding pathway.
p-value: calculating the probability of the number of targets or more mapped in the corresponding pathway by random.
Click the “GO enrichment” button and you will be lead to the results page of biological function GO enrichment.
GO enrichment bar plot
GO enrichment Table
Click on the one of the other GO enrichment buttons and you will be led to corresponding GO enrichment results page in the same format.
Click “Download results” button on the right side you can download the tables of known and predicted drugs, pathways as well as GO terms for the queried list of targets.
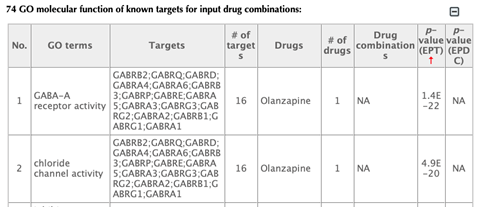
2.10 Query a list of chemical combinations
Select “A list of chemicals, targets or drug combinations” in the “Input type”
Select “chemical combinations” in the “Query type”
Enter a list of accepted drug identifiers in the “Drug combinations” box. One combination of two drugs per line, leave the other settings as default:
Click the “Submit” button and within a few seconds you will be led to a results page.
Drug-target interaction network
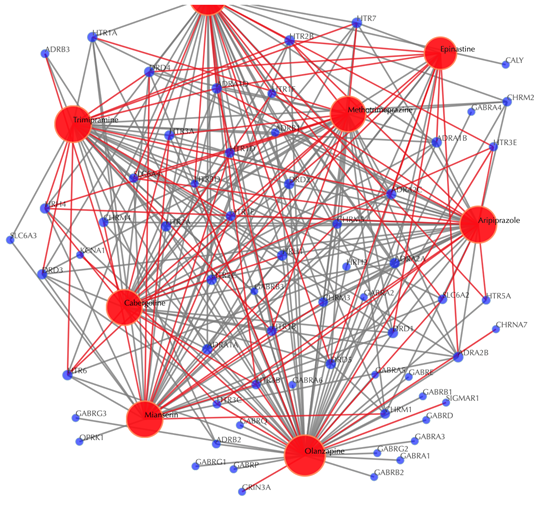
Drug-target interaction network
Red node: input drug; blue nodes: targets; grey edges: known interactions; red edges: predicted interactions. The labels of the drug nodes are the common names of the drugs and the labels of the target nodes are the gene names of the targets. Users are free to drag the nodes from this interactive network window.
Click on the “Trim 1st generation nodes” button with a cutoff of 8, (select from the neighboring drop-down box), to hide the secondary nodes with edges less than the cutoff number. For example, hide the secondary nodes with edges less than 8. This helps to identify and clearly view the targets which interact with all the 8 input drugs.
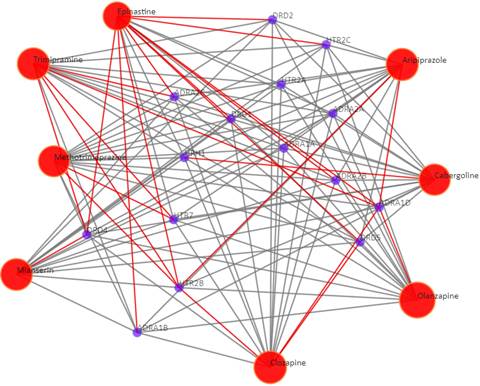
Table of the input drug combinations
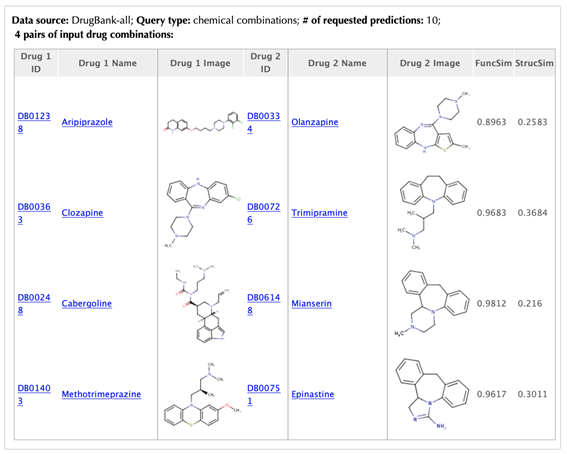
Table of the known interactions of the input drugs
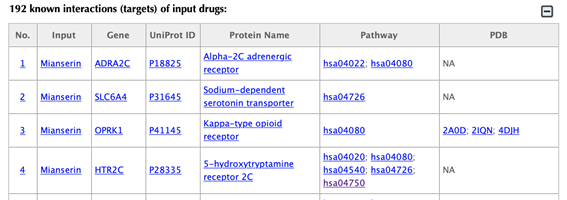
Table of the predicted interactions of the input drugs
In the interaction tables, the drug-target interaction index, drug name, gene name, uniport id, protein name, pathways, PDBs, confidence score for predicted targets are listed in separate columns.
Drug-target interaction index: for the known targets, the indexes are randomly given. For the predicted interactions, the indexes are ranked by the predicted interaction confidence scores.
Gene name: gene name of the target. Click on the hyperlink of each gene name and you will be led to the corresponding target page in DrugBank.
Uniprot ID: uniport ID of the target in the Uniprot database. Click on the hyperlink of each Uniprot ID and you will be led to the corresponding protein page in Uniport.
Protein name: common protein name on the Uniprot page. Click on the hyperlink of each protein name and you will be led to the corresponding protein page in Uniport.
Pathway: pathway ID in the KEGG database. Click on the hyperlink of each pathway and you will be led to the corresponding pathway page in KEGG.
PDB ID: PDB ID of the target structure in the PDB database. Click on the hyperlink of each PDB ID and you will be led to the corresponding PDB page in the PDB database.
Pathway network
Click on “Pathway without predictions” button on the right-hand side and you will be led to the pathway results page.
Target-pathway network
Light green rectangle: pathway; blue sphere: target; grey edges: target-pathway associations. A target node is connected to a pathway node if the target is mapped to that pathway.
This network shows the known targets-pathway associations. Click on one node or multiple nodes will fade out the nodes that are not connected to the selected nodes.
Table of known pathways of the input drugs: shows the mapped pathways for the input drugs based on known drug-target interactions.
In the pathway tables, index, pathway ID, pathway name, pathway class 1, pathway class2, targets, number of targets, p-value enriched in the input drugs, and p-value enriched in the target list are listed. If you click on a certain column header, it will sort the table by that column.
Pathway ID or pathway name: click on the hyperlink of each pathway ID or pathway name, you will be led to the corresponding pathway page in KEGG.
Pathway class: pathway class 1 and pathway class 2 are based on the BRITE hierarchy in the KEGG database. Pathway class 1 is the first layer classification, and pathway class 2 is the second layer.
Targets: list the gene names of the drug targets that are mapped in the corresponding pathway.
Number of targets: count the number of targets that are mapped in the corresponding pathway.
p-value enriched in the input drug combinations (PEDP): evaluating if the pathway is enriched given the input list of drug combinations, using hypergeometric test with FDR correction.
p-value enriched in the target list (PET): evaluating if the pathway is enriched given the list of targets, using hypergeometric test with FDR correction.
Click on the “Pathways with predictions” button, additional predicted targets appeal on the target-pathway network:
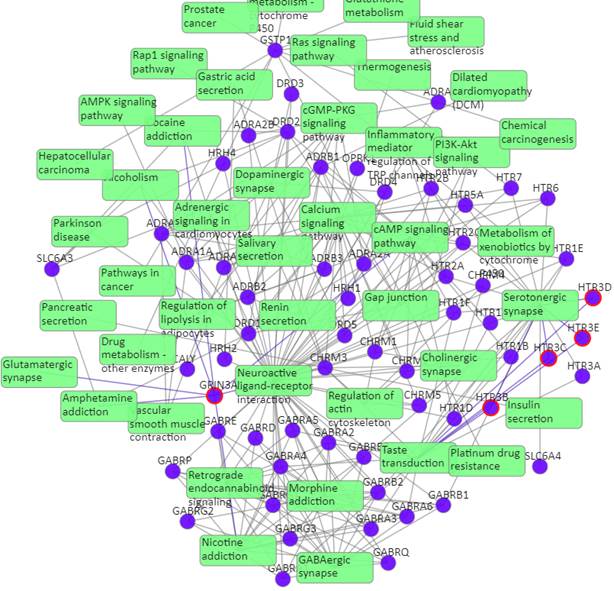
Target-pathway network (both known and predicted targets)
Light green rectangle: pathway; blue sphere: known target; blue sphere with red circle: predicted target; grey edges: target-pathway associations. A target node is connected to a pathway node if the target is mapped to that pathway. This network shows both known and predicted target-pathway associations, click on one node or multiple nodes will fade out the nodes that are not connected to the selected nodes.
Click on the “Drug-target interactions” button to get back to the drug-target interaction result page.

Click on the “GO enrichment” button to go to the GO enrichment results page.
On the GO results page, you can find six buttons for GO results in three different domains (molecular function, biological process and cellular component) with or without predictions. Each page is organized in the same way, we will use the default page “GO function without predictions” as an example to demonstrate.
GO enrichment bar plot
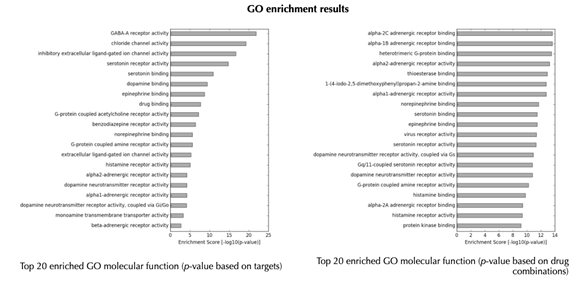
GO enrichment table
Click on the “Download results” hyperlink to download all the result tables.